Exploring Building Height Measurements and Statistical Concepts
Dive into the world of student measurements of building heights, exploring concepts such as mean, standard deviation, outliers, and identifying bad data. Understand the significance of errors in measurements and how they can impact data analysis, with insights on the distribution of measurements within standard deviations.

Download Presentation

Please find below an Image/Link to download the presentation.
The content on the website is provided AS IS for your information and personal use only. It may not be sold, licensed, or shared on other websites without obtaining consent from the author. If you encounter any issues during the download, it is possible that the publisher has removed the file from their server.
You are allowed to download the files provided on this website for personal or commercial use, subject to the condition that they are used lawfully. All files are the property of their respective owners.
The content on the website is provided AS IS for your information and personal use only. It may not be sold, licensed, or shared on other websites without obtaining consent from the author.
E N D
Presentation Transcript
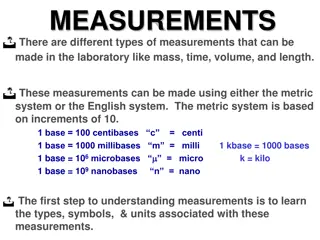
Discussing the student measurements of building height. Letting them originate concepts for: Multiple measures Mean Standard Deviation Outliers / identifying bad data
A poll with 3% error When errors are random, 2/3 of measurements are within one std. dev. And 95% are within two standard deviations
For true aficionados, the error (Standard deviation) in a random sample is close to the square root of the number you sample 100 10 gives 10% error 1000 30 or so gives 3% error
If you take 100 measurements, how many will be 2 standard deviations high, purely by chance? When errors are random, 2/3 of measurements are within one std. dev. And 95% are within two standard deviations We have >100 in our class, so


")