Exploring Data Organization and Analysis Techniques
Dive into the world of data organization through coding, data entry, cleaning, processing, and file handling. Explore topics like outliers, missing values, frequency distributions, and quantiles. Learn how to create charts for qualitative and quantitative variables using tools like SPSS, JASP, R, and jamovi. Understand the basics of variable classification, scales, and transformations to effectively manage and analyze data.

Download Presentation

Please find below an Image/Link to download the presentation.
The content on the website is provided AS IS for your information and personal use only. It may not be sold, licensed, or shared on other websites without obtaining consent from the author. If you encounter any issues during the download, it is possible that the publisher has removed the file from their server.
You are allowed to download the files provided on this website for personal or commercial use, subject to the condition that they are used lawfully. All files are the property of their respective owners.
The content on the website is provided AS IS for your information and personal use only. It may not be sold, licensed, or shared on other websites without obtaining consent from the author.
E N D
Presentation Transcript
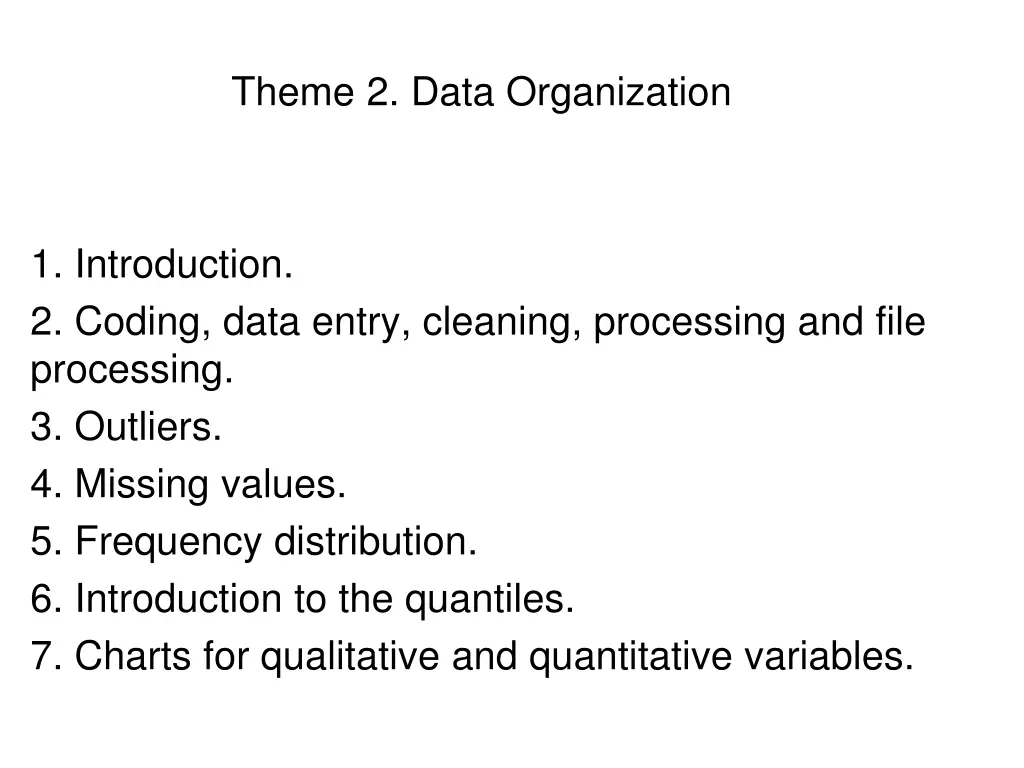
Theme 2. Data Organization 1. Introduction. 2. Coding, data entry, cleaning, processing and file processing. 3. Outliers. 4. Missing values. 5. Frequency distribution. 6. Introduction to the quantiles. 7. Charts for qualitative and quantitative variables.
Coding, data entry, cleaning, processing and file processing. (To see in practice classes) Statistical program: SPSS, JASP, R, jamovi Missing data. Classification of variables, scales, transformations, etc.
CHARTS: Standard charts Types of Variable CHART X AXIS Y AXIS Values of the variable BAR CHART Frequencies Nominal (Qualitative) PIE CHARS -- -- Values of the variable BAR CHART Frequencies Ordinal or Discrete (quantitative) FREQUENCY POLYGONS Values of the variable Frequencies FREQUENCY POLYGONS Values of the variable Continuous Quantitative Frequencies Values of the variable HISTOGRAM Frequencies
Bar chart 40 Categorical variable (NOMINAL) 30 Frecuencias Bar chart (rectangles) Pictograph or pie chart 20 10 0 Soltero CasadoDivor. Viudo Pie chart Estado Civil 6% 17% Viudo/a Soltero/a Casado/a Divorciado/a 19% 58%
variables: Ordinal Quantitative (discrete) Bar chart Cumulative bar chart Frequency polygon Diagrama de barres Diagrama de barres acumulatiu 10 20.0 9 8 15.0 Frecuencia acumulada 7 Freq ncies 6 5 10.0 4 3 5.0 2 1 0 0.0 0 1 2 3 4 0 1 2 3 4 Nombre de fills Nombre de fills
Polgono de frecuencias acumuladas Quantitative Variable (continuous) (data grouped in intervals) 120 na Frecuencias acumuladas 100 80 1. Histogram 2. Frequency polygon 3. Cumulative frequency polygon 60 40 20 0 10 20 30 40 50 60 70 Histograma Puntuaci n en Ansiedad Pol gono de frecuencias 30 30 ni Frecuencias 20 20 Frecuencias 10 10 0 0 15,5 21,5 27,5 33,5 39,5 45,5 51,5 57,5 63,5 69,5 15,5 21,5 27,5 33,5 39,5 45,5 51,5 57,5 63,5 69,5 Puntuaci n en Ansiedad Puntuaci n en Ansiedad
Exploratory graphs: stem-and-leaf display From each score can distinguish two parts: Stem (first or first few digits) (common for different data) Leaf (other digits) Ex. 10 12 21 21 22 25 31 32 34 37 38 40 1|02 2|1125 3|12478 4|0 3|12478 2|1125 1|02 4|0 Main advantage: It allows us to identify each individual score while offering the whole picture of the distribution
Exploratory graphs: box plot We can have an estimate of central tendency (the bar within the box; median) as well as variability (the limits of the box are the 75th and the 25th percentile). 9 14,00 12,00 10,00 8,00 6,00 Moreover they report "atypical" scores 4,00 2,00 ansiedad_Hom
Frequency Distributions Elements VARIABLE VALUES IN THE SAMPLE (Xi) ABSOLUTE FREQUENCY (ni): number of times the value Xi is repeated in the sample RELATIVE FREQUENCY (pi): The ratio of the absolute frequency of a certain value Xi and the size of the sample (pi = ni / n) (PROPORTION) ABSOLUTE FREQUENCY CUMULATIVE (na): number of times the value Xi or any lower value is repeated Cumulative relative frequency (pa): ratio of the cumulative absolute frequency of a certain value Xi and the size of the sample (pa = na / n) (CUMULATIVE PROPORTION)
Frequency Distributions Number of sibblings Rel.Freq prop. Cum.abs .frec Number Abs.Freq. Cum.rel.frec Xi 4 3 2 1 0 ni 1 3 7 6 3 20 pi na 20 19 16 9 3 pa 0.05 0.15 0.35 0.30 0.15 1.00 1.00 0.95 0.80 0.45 0.15


