Exploring Gender Equality in Mongolia through Census Data Analysis
"Delve into Mongolia's gender equality landscape using insights from the 2010 Population and Housing Census. Discover gender disparities in age, households, education, and more. Gain valuable perspectives from monographs by analysts at the NSO of Mongolia."

Download Presentation

Please find below an Image/Link to download the presentation.
The content on the website is provided AS IS for your information and personal use only. It may not be sold, licensed, or shared on other websites without obtaining consent from the author. If you encounter any issues during the download, it is possible that the publisher has removed the file from their server.
You are allowed to download the files provided on this website for personal or commercial use, subject to the condition that they are used lawfully. All files are the property of their respective owners.
The content on the website is provided AS IS for your information and personal use only. It may not be sold, licensed, or shared on other websites without obtaining consent from the author.
E N D
Presentation Transcript
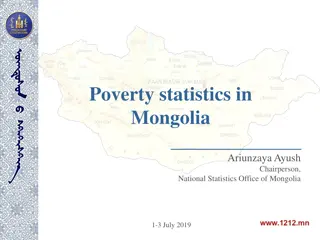
Mongolia country experience Gender Equality Monograph based on the 2010 Population and Housing Census Ms.Tsogzolmaa, Analyst Ms. Lkhagvadulam, Analyst NSO of Mongolia 2013.04.19
CONTENTS Brief about censuses in Mongolia Main analysis of census results on gender perspective: Changes in age and sex composition Gender disparities in households and families Gender disparities in internal migration Education and school enrollment
POPULATION AND HOUSING CENSUSES: BRIEF OF MONGOLIA SEX RATIO 1390.8 2010 98.1 2754.7 thous 1363.9 1195.5 2000 2373.5 thous 98.5 1178.0 1023.3 1989 99.7 2044.0 thous 1020.7 Two millionth citizen of Mongolia was born in 1988. 796.1 1595.0 thous 100.3 1979 798.9 Average annual population growth rate was 2.9 during these years, highest in the 20th century. 600.2 1197.6 thous 1969 99.4 597.4 509.1 1017.1 thous 99.8 1963 508.0 425.2 One millionth citizen of Mongolia was born in 1962. 845.5 thous 1956 98.8 420.3 387.8 Average annual population growth rate was 0.3 during war years, lowest in the 20th century. 754.2 thous 1944 95.7 371.3 367.4 1935 100.9 738.2 thous 370.8 317.3 1918 104.1 647.5 thous 330.2 Female Male
6th out of 14 monographs based on the 2010 PHC Done by external researchers; 2nd monograph on Gender Equality based on census results; Objectives: Monitor and assess the implementation of the National Programme for Gender Equality ; Capture gender disparity in the population age, sex composition, households and families, education and employment;
Population, births and deaths, by sex, by census years Population (thous.) Births Deaths Sex ratio at birth Sex ratio at death Censuses Sex ratio Total Male Female Total Male Female Total Male Female Total 2754.7 1363.9 1390.8 98.1 2010 63 270 32 299 30 971 104.3 18 293 10 781 7 512 143.5 Resident 2647.5 1314.0 1333.6 98.5 Abroad 2000 107.1 50.0 57.2 87.4 2373.5 1178.0 1195.5 98.5 48 721 24 832 23 889 103.9 15 472 8 683 6 789 127.9 1989 2044.0 1020.7 1023.3 99.7 73 593 37 591 36 002 104.4 17 000 9 421 7 579 124.3 1979 1594.4 798.3 796.1 100.3 60 233 30 826 29 407 104.8 15 375 8 333 7 042 118.3 1969 1188.3 592.3 596.0 99.4 46 849 23 753 23 096 102.8 13 905 7 342 6 563 111.9 1963 1017.2 508.0 509.1 99.8 40 250 19 813 20 437 96.9 12 168 6 218 5 950 104.5 1956 845.5 420.3 425.2 98.8 26 825 13 807 13 018 106.1 10 573 5 224 5 349 97.7 1944 759.1 371.3 387.8 95.7 - - - - - - - - 1935 738.2 370.8 367.4 100.9 13 700 7 037 6 663 105.6 12 083 6 006 6 077 98.8 1918 647.5 330.2 317.3 104.1 - - - - - - - -
Population age sex pyramid 2000, 2010 75+ Female Male 70-74 65-69 60-64 2000 55-59 2010 50-54 45-49 40-44 35-39 30-34 25-29 20-24 15-19 10-14 5-9 0-4 200 000 150 000 100 000 50 000 0 50 000 100 000 150 000 200 000
Key indicators for population age and sex composition 2010 2000 Change Indicators Total Male Female Total Male Female Total Male Female Share of population 0-14 15-64 65+ Total 28.0 68.1 3.8 100.0 28.7 68.1 3.3 100.0 27.4 68.2 4.4 100.0 35.8 60.8 3.5 100.0 36.3 60.8 2.9 100.0 35.2 60.8 4.0 100.0 -7.8 7.4 0.4 -7.7 7.3 0.3 -7.9 7.4 0.4 - - - Dependency ratio 0-14 65+ Total 41.1 5.6 46.7 42.1 4.8 46.9 40.1 6.5 46.6 58.9 5.7 64.6 59.8 4.8 64.6 57.9 6.6 64.5 -17.8 0.0 -17.8 -17.7 0.0 -17.7 -17.8 -0.1 -17.9 25.7 25.1 26.2 21.6 21.2 22.0 4.1 3.9 4.2 Median age Agean index 60+ 65+ 20.4 13.7 17.2 11.3 23.7 16.2 14.6 9.7 12.8 8.0 16.5 11.4 5.7 4.1 4.4 3.3 7.2 4.8
Population sex ratio, by age groups, 2000, 2010 0-4 110.0 5-9 100.0 75+ 10-14 90.0 80.0 70-74 15-19 70.0 60.0 65-69 20-24 2010 2000 50.0 60-64 25-29 2010 55-59 30-34 50-54 35-39 45-49 40-44 Difference between male and female life expectancy at birth was 5.7 years in 2000, however, it has increased to 7.3 years in 2010.
Sex ratio of urban and rural population, by age groups, 2000, 2010 Urban Rural 110.0 140.0 130.0 100.0 2000 120.0 2010 90.0 110.0 2010 100.0 80.0 2000 90.0 70.0 80.0 70.0 60.0 60.0 50.0 50.0 0 10 20 30 40 50 60 70 0 10 20 30 40 50 60 70 Sex ratio of urban population reached 94.4 in 2010, down by 1.2 pp since 2000, whereas, sex ratio of rural population reached 108, up by 5.4 pp.
Difference between number of urban and rural population, by age groups Urban Rural 75+ 75+ Male Female 70-74 70-74 Female Male 65-69 65-69 60-64 60-64 2000 2010 2000 2010 55-59 55-59 50-54 50-54 45-49 45-49 40-44 40-44 35-39 35-39 30-34 30-34 25-29 25-29 20-24 20-24 15-19 15-19 10-14 10-14 5-9 5-9 0-4 0-4 10 0008 000 6 000 4 000 2 000 0 2 000 4 000 6 000 8 00010 000 8 000 3 000 2 000 7 000 12 000 In 2000, females outnumbered males by 21.8 thousand in urban areas, which has increased 1.7 times in 2010. In rural areas, males outnumbered females by 12.8 thousand in 2000 and it has increased 2.5 times between 2000-2010.
Number and percentage of households, by sex of head of HH and types of HH Number Percentage Variables 2010/2000 (%) 2000 541 149 452 704 88 445 35 410 21 177 14 233 340 590 302 713 37 877 150 431 117 210 33 221 14 718 11 604 3 114 2010 713 780 560 224 153 556 75 917 42 278 33 639 445 048 380 296 64 752 177 898 127 071 50 827 14 917 10 579 4 338 2000 2010 Total Male Female Total Male Female Total Male Female Total Male Female Total Male Female 100.0 83.7 16.3 100.0 59.8 40.2 100.0 88.9 11.1 100.0 77.9 22.1 100.0 78.8 21.2 100.0 78.5 21.5 100.0 55.7 44.3 100.0 85.5 14.5 100.0 71.4 28.6 100.0 70.9 29.1 31.9 23.8 73.6 114.4 99.6 136.3 30.7 25.6 71.0 18.3 8.4 53.0 1.4 -8.8 39.3 Total Single Nuclear Extended Composite
Single parent households, by residence, 2000, 2010 National total Urban Rural 75+ 75+ Female Male Female Male Male Female 75+ 70-74 70-74 70-74 2000 65-69 65-69 65-69 60-64 60-64 60-64 2010 55-59 55-59 55-59 50-54 50-54 50-54 45-49 45-49 45-49 40-44 40-44 40-44 35-39 35-39 35-39 30-34 30-34 30-34 25-29 25-29 25-29 20-24 20-24 20-24 15-19 15-19 15-19 2 000 1 000 0 1 000 2 000 3 000 5 000 0 5 000 10 000 15 000 5 000 0 5 000 10 000 There were increases in the number of single parent households in all age groups, particularly in the age group 40-54.
Percentage of single parent families, by employment status and residence, 2000, 2010 Male headed single parent families Female headed single parent families 2010 37.9 62.1 Total 43.2 56.8 Total Employed 34.7 65.3 Urban 43.3 56.7 Urban Unemployed 44.5 55.5 Rural 42.8 57.2 Rural Male headed single parent families Female headed single parent families 2000 39.8 60.2 Total 43.5 56.5 Total Employed 41.2 58.8 Urban 33.8 66.2 Urban Unemployed 47.4 52.6 Rural 47.4 52.6 Rural
Number of Migrants by sex ratio, timing of migration, and thousand persons, 2000, 2010 2000 2010 Lifetime 1 097.6 SR=106.0 610.7 SR=109.6 Five year migration 317.7 SR=102.0 181.4 SR=101.9 79.0 114.2 SR=114.8 SR=118.8 One year migration In 2000, 47.7 percent of lifetime migrants were female, while this percentage has slightly increased to 48.5 percent in 2010.
Differences between male and female migrants who migrated for over a year in urban and rural areas, by age groups, 2010 65+ Female Male 60-64 55-59 Urban 50-54 Rural 45-49 40-44 35-39 30-34 25-29 20-24 15-19 10-14 5-9 2 500 2 000 1 500 1 000 500 0 500 1 000 1 500 2 000 2 500
Difference in number of males and females who born in or migrated to current aimag and capital, 2000, 2010 2010 Male Female 2000 Foreign Male Female 8 123 Foreign Gobisumber Orkhon Orkhon Darkhan-Uul Darkhan-Uul Uvs 8 913 Umnugobi Bayan-Ulgii Bayan-Ulgii Gobisumber Dundgobi Zavkhan Selenge Dundgobi Bulgan Selenge Sukhbaatar Sukhbaatar Khentii Khentii Khovd Dornogobi Umnugobi Uvs Tuv Bayankhongor Bayankhongor Tuv Bulgan Dornod Arkhangai 37 796 Ulaanbaatar Dornogobi Khovd Uvurkhangai Gobi-Altai Dornod Born Currently residing Uvurkhangai Gobi-Altai Born Currently residnig Zavkhan Khuvsgul Arkhangai 21 785 Ulaanbaatar 6 629 3 000 Khuvsgul 3 578 4 000 3 000 2 000 1 000 0 1 000 2 000 4 000 4 000 3 000 2 000 1 000 0 1 000 2 000 3 000 4 000 Number of aimags with non-migrant males has increased between two censuses. More females now live in urban areas.
Economic activity of population aged 15 and above, by migration status, sex, and percentage, 2010 39% 43% 50% 50% 50% 56% 61% 62% 63% 65% 65% Economically active (SR=121.5) 61% 57% 50% 50% 50% Economically inactive (SR=71.8) 44% 39% 38% 37% 35% 35% Total Male Female Male Female Male Female Male Female Male Female Total Lifetime Moved in 5 year 1 year Males are more economically active than females, especially among recent migrants.
Age and sex pyramid of children dropped out of school, 2010 Male Female 15 14 13 12 11 10 9 8 7 6 2 500 1 500 500 500 1 500 2 500 63 percent of school dropouts was among boys and 37 percent among girls.
Number of children aged 6-15 dropped out of school, by sex and regions, 2010 3 500 Male Female 3 000 2 500 2 000 1 500 1 000 500 0 Western Khangai Central Eastern Ulaanbaatar More boys drop out of school in all regions.
Educational levels of population aged 15 and above, by sex, and percentage, 2010 0.2 Doctorate 0.2 Female 2.0 Master Male 1.4 22.5 High education 16.5 Specialized secondary 8.0 5.4 3.0 Vocational 3.6 37.1 Secondary 38.1 17.2 Basic 23.1 9.9 Primary 11.7 More women have higher education. More men have lower educational attainment.
Population aged 15 and above acquiring education higher than specialized secondary, by age groups 50.0 45.0 Male 2000 40.0 35.0 Female 2000 30.0 25.0 20.0 Female 2010 15.0 10.0 Male 2010 5.0 0.0 15-19 20-24 25-29 30-34 35-39 40-44 45-49 50-54 55-59 60+ Higher education attainment of women than men may influence the decline in fertility and growing tendency for women to be independent from men.
THANK YOU FOR YOUR ATTENTION www.nso.mn www.1212.mn
26th Population Census Conference Organized by the Association of National Census and Statistics Directors of America, Asia and Pacific www.ANCSDAAP.org Hosted by the NSO Mongolia Date: June 26-28, 2013 Ulaanbaatar, Mongolia Theme: Census Analysis and Dissemination Welcome to Mongolia