Delve into the world of statistics with an introduction to its components, branches, and real-world applications. From defining populations and samples to understanding inferential statistics, this overview covers the essentials for a solid foundation in statistical analysis.
Please find below an Image/Link to download the presentation.
The content on the website is provided AS IS for your information and personal use only. It may not be sold, licensed, or shared on other websites without obtaining consent from the author. If you encounter any issues during the download, it is possible that the publisher has removed the file from their server.
You are allowed to download the files provided on this website for personal or commercial use, subject to the condition that they are used lawfully. All files are the property of their respective owners.
The content on the website is provided AS IS for your information and personal use only. It may not be sold, licensed, or shared on other websites without obtaining consent from the author.
E N D
Presentation Transcript
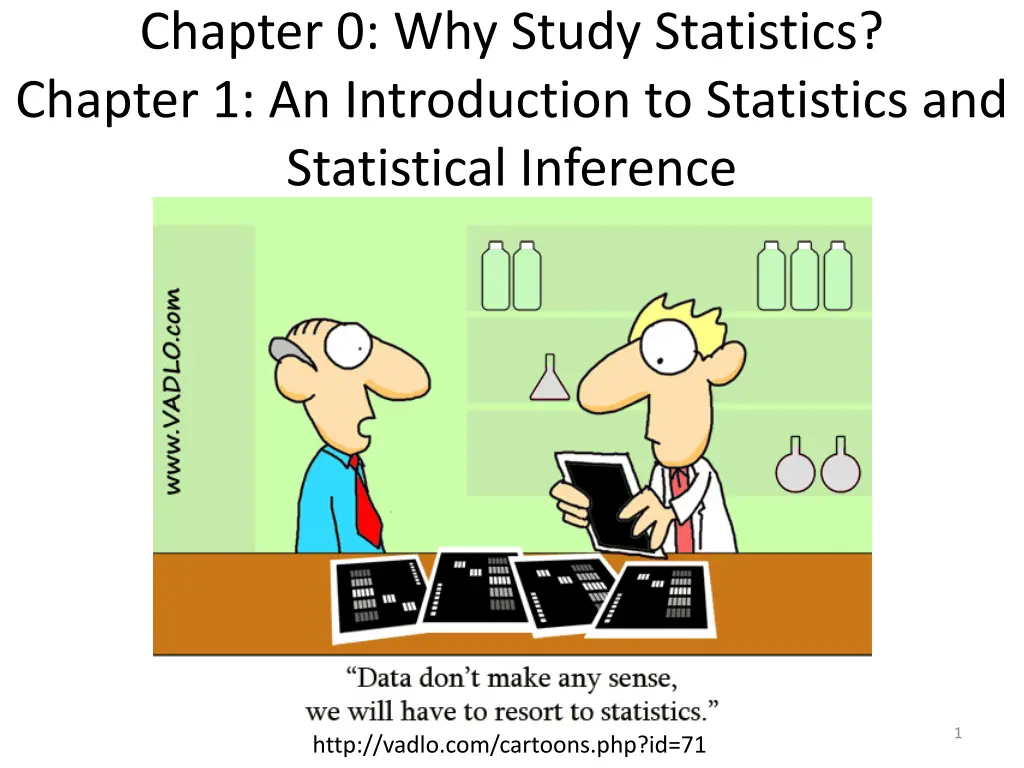
Chapter 0: Why Study Statistics? Chapter 1: An Introduction to Statistics and Statistical Inference 1 http://vadlo.com/cartoons.php?id=71
0,1: Introduction: Goals Create your own definition of statistics. State some applications of Statistics for your field. State the branches of statistics and briefly describe each one. Define: Population, sample, variable Differentiate between probability and statistics. Be able to solve word problems in statistics. 2
What is Statistics Components Collection Organization Analysis Interpretation 3
Branches of Statistics Collection of data Descriptive Statistics Graphical and numerical methods used to describe, organize, and summarize data. Inferential Statistics Techniques and methods used to analyze a small, specific set of data in order to draw a conclusion about a large, more general collection of data. 4
Inferential Statistics Claim Status Quo Experiment Check claim Likelihood How likely is the experimental result consistent with the claim? Conclusion The outcome is reasonable The outcome is rare. 5
Definitions A population is the entire collection of individuals or objects to be considered or studied. A sample is a subset of the entire population, a small selection of individuals or objects taken from the entire collection. 6
Solution Trail 1. Find the keywords. 2. Correctly translate these words in statistics. 3. Determine the applicable concepts. 4. Develop a vision, or strategy, for the solution. 5. Solve the problem. 8
Types of Data, Graphing: Goals Section 2.1 Classify variables as Number of characteristics Categorical or numerical Section 2.2 (very brief) Analyze the distribution of categorical variable: Bar Graphs Pie Charts Section 2.3: Skip Section 2.4 Analyze the distribution of quantitative variable: Histogram Identify the shape, center, and spread Identify and describe any outliers 10
Types of Variables Number univariate bivariate multivariate Type Categorical Numerical 11
To better understand a data set, ask: Who? What cases do the data describe? How many cases? What? How many variables? What is the exact definition of each variable? What is the unit of measurement for each variable? Why? What is the purpose of the data? What questions are being asked? Are the variables suitable? 12
Graphs Categorical Variables Pie charts Bar graphs Quantitative Variables Histograms 13
Examining Distributions In any graph of data, look for the overall pattern and for striking deviations from that pattern. You can describe the overall pattern by its shape, center, and spread. For the shape, look at the number of peaks and the symmetry. An important kind of deviation is an outlier, an individual that falls outside the overall pattern. 14
Frequency Distribution The possible values and how often that it takes these values. The label or class is the category of the data. The frequency is the count. Relative Frequency=frequency total count 15
Categorical Variables - Display The distribution of a categorical variable lists the categories and gives the count or percent or frequency of individuals who fall into each category. Pie charts show the distribution of a categorical variable as a pie whose slices are sized by the counts or percents for the categories. Bar graphs represent categories as bars whose heights show the category counts or percents. 16
Quantitative Variable: Histograms Histograms show the distribution of a quantitative variable by using bars. Remember to always include the summary table. Procedure discrete (small number of values) 1. Calculate the frequency distribution and/or relative frequency of each x value. 2. Mark the possible x values on the x-axis. 3. Above each value, draw a rectangle whose height is the frequency (or relative frequency) of that value. 17
Shapes of Histograms - Number Symmetric unimodal bimodal multimodal 18 http://www.particleandfibretoxicology.com/content/6/1/6/figure/F1?highres=y


")
")