Exploring Weather Factors and Outdoor Mobility in Fulton County
This project by Ethan Wang aims to analyze the correlation between weather factors such as air quality, temperature, precipitation, and wind with outdoor mobility in Fulton County. Data sources include EPA air quality data and mobility trends from Google. Techniques used include correlation analysis, multivariate regression, and uncertainty analysis. The study found weak positive correlations between air quality (PM 2.5 and Ozone) and mobility. Graphs depict the relationships between weather variables and mobility.
Download Presentation

Please find below an Image/Link to download the presentation.
The content on the website is provided AS IS for your information and personal use only. It may not be sold, licensed, or shared on other websites without obtaining consent from the author. If you encounter any issues during the download, it is possible that the publisher has removed the file from their server.
You are allowed to download the files provided on this website for personal or commercial use, subject to the condition that they are used lawfully. All files are the property of their respective owners.
The content on the website is provided AS IS for your information and personal use only. It may not be sold, licensed, or shared on other websites without obtaining consent from the author.
E N D
Presentation Transcript
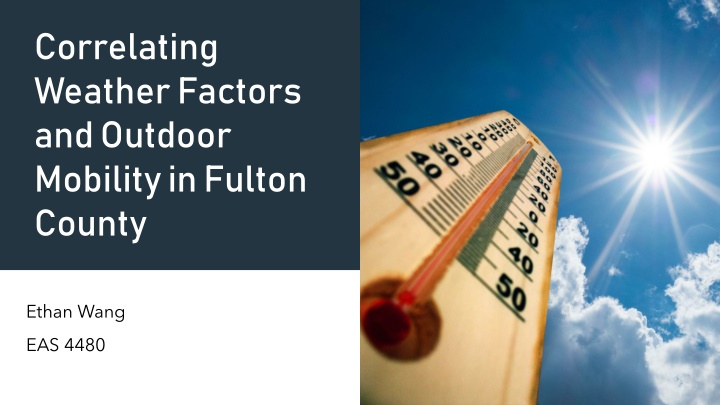
Correlating Weather Factors and Outdoor Mobility in Fulton County Ethan Wang EAS 4480
Project Goal Initially, to determine poor air quality and smog s impact on people s lives Extended to other weather factors such as temperature, precipitation, and wind Measure the impact of weather conditions on outdoor recreation
Data Sources Air Quality Data from EPA Atlanta / United Avenue Site Year-long Weather Data from Metostat Atlanta / Carroll Heights Station Mobility Trends obtained from Community Mobility Reports from Google Example Air Quality Data Used to measure the effects of COVID-19
Time Period of Data Data is from March 15 July 17, 2021 Flattened curve should reduce the impact of COVID-19 lockdowns on data Covid-19 Cases in Fulton County, GA Data was taken from the highlighted period
Techniques Used Correlation Analysis between weather factors and mobility in parks Multivariate Regression Uncertainty Analysis: 95% confidence interval of correlation coefficient from Bootstrap Standard Error Analysis
Correlation Air Quality & Mobility Weak Positive Correlation Found for both PM 2.5 and Ozone R: 0.2432, 0.2187 Confidence Intervals Low: 0.1094, 0.0383 High: 0.4153, 0.3631 Heat, Precipitation, likely confounding variables
Correlation Weather & Mobility Temperature Temperature (AVG) (AVG) Temperature Temperature (MIN) (MIN) Temperature Temperature (MAX) (MAX) Precipitation Precipitation (mm) (mm) Average Wind Average Wind Speed (km/h) Speed (km/h) 0.2035 0.0464 0.3077 -0.4410 -0.2863 R R 0.2008 0.0454 0.3012 -0.4312 -0.2866 Mean R from Mean R from Bootstrap Bootstrap Test Test [0.0533, 0.3474] [-0.1148, 0.1902] [0.1341, 0.4496] [-0.5633, -0.2753] [-0.4283, -0.1173] Confidence Confidence Interval from Interval from Bootstrap Test Bootstrap Test
Graphs of Correlating Variables
Multivariate Regression ? = ?0+ ?1?1+ ?2?2+ ?3?3 ? = % Change in Mobility ?1 = Max Temperature (C) ?2 = Precipitation (mm) ?3 = Average Wind Speed(km/h) ?0 .3 = Coefficients
Regression Results Residual Standard Error = 19.3685 Validation Residual Standard Error = 32.3107 ?0(Interc (Interc ept) ept) ?1(Max (Max Temperat Temperat ure) ure) ?2(Precipi (Precipi tation) tation) ?3(Wind (Wind Speed) Speed) When introducing day of the week as a variable, the error improves to: -13.7358 0.8384 -0.9535 -0.8276 Coefficients Coefficients Residual Standard Error = 12.1190 Validation Residual Standard Error = 31.5752 [-40.8611, 13.3896] [0.0005, 1.6762] [-1.3286, - 0.5784] [-1.8624, 0.2073] 95% Confidence 95% Confidence Interval Interval
Conclusion Certain Weather Factors are correlated with Outdoor Mobility Air Quality by itself is not negatively correlated with Outdoor Mobility, but more advanced analysis is needed Multivariate Regression can help predict how crowded a location will be

