Exponential Growth and the Naperian Constant
Explore the concept of exponential growth, the significance of the Naperian constant 'e', and how it is used in growth equations and population calculations. Learn about exponential growth rates, graphing, the relationship between N and t, and the concept of doubling time. Dive into solving problems involving doubling time and continuous population growth scenarios.

Download Presentation

Please find below an Image/Link to download the presentation.
The content on the website is provided AS IS for your information and personal use only. It may not be sold, licensed, or shared on other websites without obtaining consent from the author. If you encounter any issues during the download, it is possible that the publisher has removed the file from their server.
You are allowed to download the files provided on this website for personal or commercial use, subject to the condition that they are used lawfully. All files are the property of their respective owners.
The content on the website is provided AS IS for your information and personal use only. It may not be sold, licensed, or shared on other websites without obtaining consent from the author.
E N D
Presentation Transcript
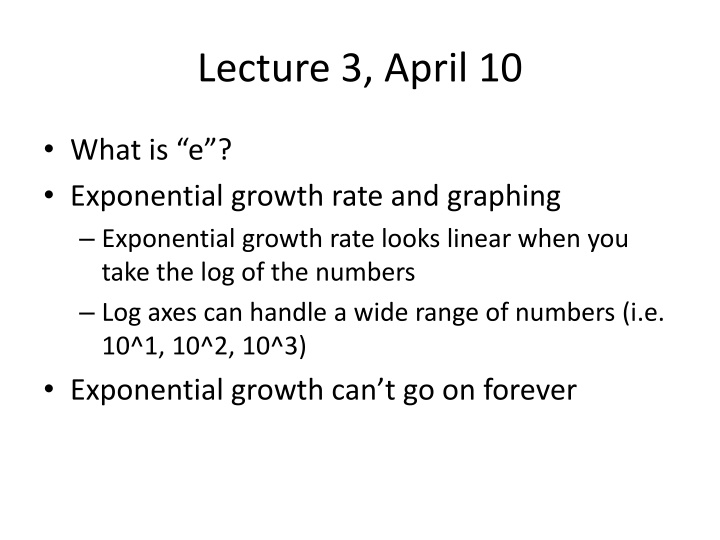
Lecture 3, April 10 What is e ? Exponential growth rate and graphing Exponential growth rate looks linear when you take the log of the numbers Log axes can handle a wide range of numbers (i.e. 10^1, 10^2, 10^3) Exponential growth can t go on forever
Review growth equation Nt+1 = N0* e r*t What is e ?
e = Naperian constant = 2.71828 How we get to e Start with 1 Over 1 unit of time growth rate of 1 Compounding interest Calculate at 1 time 1 + 1*1 = 2 Calculate at 2 times (.5 is the expected increase over half the time interval) 1 + 1*.5 + 1.5 * .5 = 2.25 Calculate at many times (rate/intervals) Go to Excel to illustrate
Why e is or friend Want to calculate population at any time with any starting point Have a function that starts with 1 and has a growth rate * t =1 Multiply it time the starting N Take e to the power of the r *t Stretches out the curve Go to the board to draw
3-1. plot this a. Draw N vs t for r = 0, N0= 500, for t = 0, 10, 20 b. Draw N vs t for r = 1, N0= 500, for t=0, 2, 5, 10 (put above 2 on the same graph) c. Draw dN/dt on the Y axis versus N on the X axis. (What equation would you use?) d. What would the slope be?
3-1. a, b: N vs t for r = 0 & 1, N0= 500, for t=0, 2, 5, 10 yr
3-1. c & d: dN/dt vs N for N0=500, r = 0, 0.5, 1 d. dN/dt = rN; slope = r
The doubling time (td) of a population is the number of years it will take the population to double in size. = ln( / ) 2 td r ln(2) is a constant 0.693. (~0.7) The larger r, the less time it takes for the population to double. Initial population size does not matter here
3-2. Doubling time problems, Solve for td using td = ln(2)/r : a. A continuously growing population of bears has a population size of 300 and its intrinsic rate of increase is 0.07 per year. Assuming that this rate of increase remains the same, about how long should it take for the population to reach 600? A. 5 years B. 10 years C. 14 years D. 20 years E. 28 years b. In 2012 the human population hit 7 bil and growth rate is 0.0118. What is the doubling time for the human population? In what year do we expect our population to hit 14 billion?
3-2. Doubling time problems, using td = ln(2)/r : a. A continuously growing population of bears has a population size of 300 (N0) and its intrinsic rate of increase is 0.07 per year (r). Assuming that this rate of increase remains the same, about how long should it take for the population to reach 600 (= 2x N0)? Ln (2)/r ~= 0.7/0.07 per yr = 10 yr b. In Oct 2011 the human population hit 7 bil and growth rate, r, is 0.0118. What is the doubling time for the human population? In what year do we expect our population to hit 14 billion if this rate keeps constant? ln (2)/r = .69/0.118 = 58.47 yr 2011.83+58.47 yr = 2070 (8 billion in 2024!)
Exponential relationships between y and x appear linear when graphed on semi-log paper. Why use a log scale for the y axis?
Growth rate slows down Can t have exponential growth for ever
Sometimes find Exponential growth, (J-curve) but other times find S-shaped curves. Why? Campbell 2010, Biology, 9th ed. Fig 53.8, Benjamin Cummings Cain et al. 2011 Ecology Fig 9.17 Sinauer Exponential growth in populations is not sustainable. What limits r?
What limits r? Food/nutrient supply Competition Climate change Hurricane Density dependent factor: a factor that changes b &/or d to a varying degree based upon population density Density independent factor: a factor that changes b &/or d but whose effect does not vary with population density
What limits r? Name three other density dependent and three other density independent factors. Food/nutrient supply Competition Climate change Hurricane Density dependent factor: a factor that changes b &/or d to a varying degree based upon population density Density independent factor: a factor that changes b &/or d but whose effect does not vary with population density
What limits r? Food/nutrient supply Competition Predation Waste production Disease Climate change Hurricane Drought Fire A cold winter Density dependent factor: a factor that changes b &/or d to a varying degree based upon population density Density independent factor: a factor that changes b &/or d but whose effect does not vary with population density
Logistic growth: growth with limits Because growth is typically slowed relative to exponential by density-dependent factors, the logistic model better mimics most pop n growth Calculate population change with logistic growth using: dN/dt = rNt(1-(N/K)) K: the carrying capacity of the local environment Growth is diminished due to competition, which is more apparent as N approaches K
Lets try using the logistic growth equation 3-3. For r = 0.667, N = 300, K = 400. By how much will the population change in a time step (= what is the population-level growth rate)? = rN dt dN N * 1 K
Q1. Lets try using the logistic growth equation dN/dt = 0.667 * 300 * (1-(300/400)) = 200*(1-(3/4)) = 200 * = 50 = dN/dt So, the population is expected to grow by 50 individuals in the next time step when population size is 300 (so will be 350). For r = .667, N = 300, K = 400. By how much will the population change in a time step (= what is the population- level growth rate)? 1 dN N = * rN dt K
3-4. How does population growth change across population size? At what point will you have greatest population-level growth? Why? dN dt =rN 1-N K Calculate & plot values for r = 0.2, K = 100,000 and: N = 10, N = 100, N = K/2, N = 75,000, N = K, N = 150,000. Population- level growth rate, dN/dt 0 K/2 K 3K/2 Population size, N Why is the population growth low at low N? Why is low (or negative) at high N?
3-4. How population growth changes across N? At what point will you have greatest population-level growth? Why? dN dt =rN 1-N K r = 0.2, K = 100,000; N = 10, 100, K/2, 75,000, K, 150,000 N dN/dt 10 2 K/2 K 3K/2 100 20 50000 75000 100000 150000 -15000 5000 3750 0 Why is the population growth low at low N? Why is low (or negative) at high N?


 of a population is the")