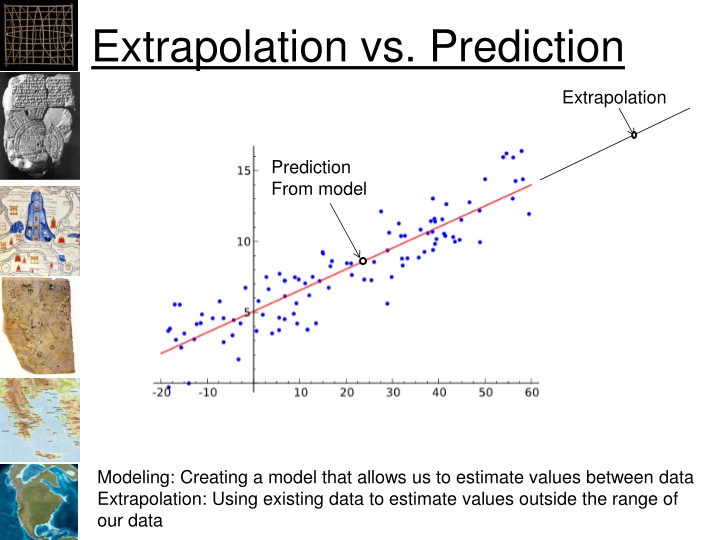
Extrapolation vs. Prediction
Explore the concepts of modeling, prediction, model selection, simplicity, parsimony, likelihood, and applying them in statistical analysis. Understand the importance of selecting the right variables, methods, and parameter values for reliable predictions.

Download Presentation

Please find below an Image/Link to download the presentation.
The content on the website is provided AS IS for your information and personal use only. It may not be sold, licensed, or shared on other websites without obtaining consent from the author.If you encounter any issues during the download, it is possible that the publisher has removed the file from their server.
You are allowed to download the files provided on this website for personal or commercial use, subject to the condition that they are used lawfully. All files are the property of their respective owners.
The content on the website is provided AS IS for your information and personal use only. It may not be sold, licensed, or shared on other websites without obtaining consent from the author.
E N D
Presentation Transcript
Extrapolation vs. Prediction Extrapolation Prediction From model namNm15 Modeling: Creating a model that allows us to estimate values between data Extrapolation: Using existing data to estimate values outside the range of our data
Model Selection Need a method to select the best set of independent variables (covariates/predictors) Also the the best method and estimated parameter values (coefficients) Should be a balance between fitting the data and simplicity R2 only considers fit to data (but linear regression is pretty simple) namNm15
Simplicity Everything should be made as simple as possible, but not simpler. Albert Einstein namNm15 Photograph by Oren Jack Turner, Princeton, licensed through Wikipedia
Parsimony too few parameters and the model will be so unrealistic as to make prediction unreliable, but too many parameters and the model will be so specific to the particular data set so to make prediction unreliable. Edwards, A. W. F. (2001). Occam s bonus. p. 128 139; in Zellner, A., Keuzenkamp, H. A., and McAleer, M. Simplicity, inference and modelling. Cambridge University Press, Cambridge, UK. namNm15
Parsimony Under fitting model structure included in the residuals Over fitting residual variation is included as if it were structural Parsimony namNm15 Anderson
Likelihood Likelihood of a set of parameter values given some observed data=probability of observed data given parameter values Definitions ? = all sample values ??= one sample value = set of parameters ? ? ? =probability of x, given See: ftp://statgen.ncsu.edu/pub/thorne/molevocla namNm15 ftp://statgen.ncsu.edu/pub/thorne/molevoclass/pruning2013cme.pdf ftp://statgen.ncsu.edu/pub/thorne/molevoclass/pruning2013cme.pdf ss/pruning2013cme.pdf
Likelihood namNm15
p(x) for a fair coin ? = ? ?1? ? ?2? 0.5 Heads Tails namNm15 What happens as we flip a fair coin?
p(x) for an unfair coin 0.8 ? = ? ?1? ? ?2? Heads 0.2 Tails namNm15 What happens as we flip a fair coin?
p(x) for a coin with two heads 1.0 ? = ? ?1? ? ?2? Heads 0.0 Tails namNm15 What happens as we flip a fair coin?
Maximum Likelihood Want to maximize the likely hood ? = (??) Because ??are small (<1), ? becomes really small with large datasets (too small to compute) Taking the Negative Natural Log of ? provides a number that decreases to 0 as the likelihood increases Or: 2 ln(?) namNm15
-2 Times Log Likelihood namNm15
Akaike Information Criterion AIC K = number of estimated parameters in the model L = Maximized likelihood function for the estimated model ??? = 2? 2 ln(?) namNm15
AIC Only a relative meaning Smaller is better Balance between complexity: Over fitting or modeling the errors Too many parameters And bias Under fitting or the model is missing part of the phenomenon we are trying to model Too few parameters namNm15
Deviance ???????? = 2[?? ??] Where: ??= Maximum log-likelihood for model ??= Maximum log-likelihood for the most complex model possible (i.e. fits observed data perfectly) namNm15
Degrees of Freedom ? = number of observations ? = number of parameters Degrees of freedom = ? ? namNm15
AICc Additional penalty for more parameters ???? = ??? +2?(?+1) ? ? 1 Recommended when n is small or k is large namNm15
BIC Bayesian Information Criterion Adds n (number of samples) ??? = 2? ??(?) 2 ln(?) namNm15
Extra slides namNm15
Does likelihood from p(x) work? If the likelihood is the probability of the data given the parameters, and a response function provides the probability of a piece of data (i.e. probability that this is suitable habitat) We can use the probability that a specific occurrence is suitable as the p(x|Parameters) Thus the likelihood of a habitat model (while disregarding bias) Can be computed by L(ParameterValues|Data)=p(Data1|ParameterValues)*p(Data2|ParameterValues). .. Does not work, the highest likelihood will be to have a model with 1.0 everywhere, have to divide the model by it s area so the area under the model = 1.0 namNm15 Remember: This only works when comparing the same dataset!
Akaike Akaike showed that: log ? ???? ? ????log ? ?| ?(?) Which is equivalent to: log ? ???? ? = ???????? ? ?I ?, ? Akaike then defined: AIC = 2log ? ???? + 2? namNm15
Discrete: ???= ln(? ? Continuous: ? ?)?(?) ln ? ? ? ? ???(?||?) = Justification: ???(?| ? = ? ? log(? ? + ? ? log(?(?) ? ? ?? namNm15
The distance can also be expressed as: ? ?,? = ? ? ??? ? ? ?? ? ? ??? ? ? ? ?? ? ? is the expectation of ? ? so: ? ?,? = ??log ? ? Treating ??log ? ? constant: ??log ? ? ? as an unknown = Relative ? ?,? ? = ??log ? ? ? Distance between g and f namNm15


 for a fair coin")
 for an unfair coin")
 for a coin with two heads")


 work?")