Explore how data from multiple studies is used to predict VMMC unit costs in Sub-Saharan Africa. The research aims to create cost prediction models for diverse settings, leveraging regression analysis and data standardization techniques.
Please find below an Image/Link to download the presentation.
The content on the website is provided AS IS for your information and personal use only. It may not be sold, licensed, or shared on other websites without obtaining consent from the author. If you encounter any issues during the download, it is possible that the publisher has removed the file from their server.
You are allowed to download the files provided on this website for personal or commercial use, subject to the condition that they are used lawfully. All files are the property of their respective owners.
The content on the website is provided AS IS for your information and personal use only. It may not be sold, licensed, or shared on other websites without obtaining consent from the author.
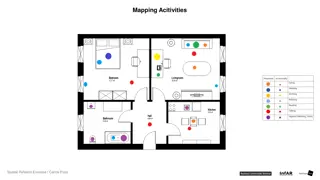
Limitations of primary data Strengths of primary data: Identify facility characteristics with strongest cost driving effects Generate unit cost scenarios across varying levels of scale Challenge: Predict unit costs for countries outside of our sample
Objective Utilize existing research on VMMC services in Africa to create cost prediction models to project the costs of VMMC in a variety of settings in Sub-Saharan Africa. Approach Collapse primary and secondary data Multivariate regression (GLM and OLS) to extrapolate countries outside our sample Validate models by removing data and predicting costs
Data Obtainment and Standardization Exclude facilities with incomplete data N=7 studies n=18 facilities Primary Data N=7 studies n= 220 facilities Received data N=7 studies n=238 facilities Standardize Data Primary data request via email N=15 studies Literature Review N= 29 studies
Data Obtainment and Standardization Unit Cost Scale Projections (Internal Validity) (Internal Validity) Unit Cost Scale Projections Exclude facilities with incomplete data N=7 studies Exclude facilities with incomplete data N=7 studies n=18 facilities n=18 facilities Collapse unit costs for facilities with the same characteristics characteristics Collapse unit costs for facilities with the same Collapsed Primary Data N=7 studies n= 38 unit cost Collapsed Primary Data N=7 studies n= 38 unit cost scenarios scenarios Primary Data N=7 studies n= 220 Primary Data N=7 studies n= 220 facilities facilities Received data N=7 studies n=238 facilities n=238 facilities Received data N=7 studies Standardize Standardize Data Data Primary data request via email N=15 studies N=15 studies Primary data request via email Pooled Data (Primary & Extracted) N=16 studies n= 47 unit cost Pooled Data (Primary & Extracted) N=16 studies n= 47 unit cost scenarios scenarios Extrapolations: Predict Costs (External Validity) (External Validity) Extrapolations: Predict Costs Not interested/ no response Not interested/ no response N=8 studies N=8 studies Literature Review N= 29 studies N= 29 studies Literature Review Collapsed Secondary Data N=9 studies n= 9 unit cost Collapsed Secondary Data N=9 studies n= 9 unit cost scenarios scenarios Secondary Data N=9 studies n= 17 unit Secondary Data N=9 studies n= 17 unit costs costs Collapse unit costs for facilities with same characteristics characteristics Collapse unit costs for facilities with same Extract data from published studies N=22 studies N=22 studies Extract data from published studies Standardize Standardize Data Data Exclude studies w/ mixed or incomple facility characteristics N=13 studies Exclude studies w/ mixed or incomple facility characteristics N=13 studies n=38 unit costs n=38 unit costs
Process of collapsing F1 Kenya, rural, hospital, private $80 Unit Cost F1 & F2 Kenya, rural, hospital, private $90 Unit Cost F2 Kenya, rural, hospital, private $100 Unit Cost F3 Kenya, rural, hospital, public $70 Unit Cost F3 & F4 Kenya, rural, hospital, public $66 Unit Cost & F5 F4 Kenya, rural, hospital, public $48 Unit Cost F5 Kenya, rural, hospital, public $80 Unit Cost F6 Kenya, rural, clinic, public $50 Unit Cost F6 Kenya, rural, clinic, public $50 Unit Cost F7 Kenya, rural, clinic, private $60 Unit Cost F7 Kenya, rural, clinic, private $60 Unit Cost
Description of Data Collapsed Primary Data Collapsed Secondary Data Pooled Data Observations Urbanicity Rural Facilities (%) Urban Facilities (%) Ownership Private facilities (%) Public facilities (%) Facility type Hospitals (%) Clinics (%) Mean unit cost per VMMC (USD) 38 9 47 50 22.2 44.7 50 77.8 55.3 36.8 63.2 33.3 66.6 36.2 63.8 52.6 47.4 66.6 33.3 55.3 44.7 64 69 65 Average number of VMMC per year 1212 -- -- Average VMMC coverage in 2016 (%) 44 7 30 9 41 16 Number of studies Average number of facilities per observation Countries 6 8 5.2 6 5 10
Extrapolation Model OLS GLM Unit cost 0.118 (0.138) 0.466*** (0.086) 0.107 (0.142) 0.098 (0.136) 2.858*** (0.595) -0.903 (1.130) 0.959 (1.092) -0.258 (0.593) 47 Variables Hospital=1, Clinic=0 Unit cost 0.156 (0.127) 0.494*** (0.084) 0.152 (0.134) 0.102 (0.124) 2.558*** (0.567) -0.584 (1.085) 0.666 (1.024) -0.327 (0.507) 47 0.664 -Variables at facility level (characteristics) -Variables at country level (GDP, coverage and prevalence) log_GDP2016 Private=1 , Public=0 Rural=1, Urban=0 Health Sector Salary Index VMMC coverage VMMC coverage 2 Two criteria: Goodness of fit Performance of predictions Constant Observations (Unit Costs Scenarios) R-squared Standard errors in parentheses *** p<0.01, ** p<0.05, * p<0.1
Results of Extrapolations Validate model: 1. Remove countries from sample, iteratively 2. Estimate parameters 3. Extrapolate unit costs
Results of Extrapolations Validate model: 1. Remove countries from sample, iteratively 2. Estimate parameters 3. Extrapolate unit costs
Conclusions: We performed VMMC unit cost prediction models, based on primary and secondary data obtained from ten African countries. We validated our predictions by systematically removing data from one country from our sample, predicting unit costs for that country and comparing them to empirical data. We combined point estimations with estimated unit cost curves for different scenarios (facility characteristics).