Facilities & Administrative Costs and Rate Calculation
Learn about Facilities & Administrative Costs at the University of Iowa, including the negotiation process, rate calculation, and breakdown by component for FY2021. Discover how F&A costs reconcile with financial statements and how recoveries are generated to offset expenses.

Download Presentation

Please find below an Image/Link to download the presentation.
The content on the website is provided AS IS for your information and personal use only. It may not be sold, licensed, or shared on other websites without obtaining consent from the author. If you encounter any issues during the download, it is possible that the publisher has removed the file from their server.
You are allowed to download the files provided on this website for personal or commercial use, subject to the condition that they are used lawfully. All files are the property of their respective owners.
The content on the website is provided AS IS for your information and personal use only. It may not be sold, licensed, or shared on other websites without obtaining consent from the author.
E N D
Presentation Transcript
Facilities & Administrative Costs and Recoveries
Facilities & Administrative (F&A) Costs and Recoveries F&A costs are actual expenses that reconcile to the UI audited Financial Statements. F&A recoveries are generated to reimburse the UI for a portion of F&A costs incurred. . Effort is made by Central Administration to return the recoveries to where the expense occurred given actual F&A costs exceed F&A recoveries.
F&A Negotiation Process A formal F&A rate is prepared by the UI and proposed every 4 years. Proposal prepared in accordance with cost principles defined in Uniform Guidance (formerly OMB Circular A-21) Direct Negotiation with Federal Govt. Feds review documentation; then perform a site visit Walk space; interview PI s, staff & students FY 2025 is the base year for next rate proposal The approved F&A rate is less than actual F&A rate.
F&A Rate Calculation University Financial Statements F&A Cost Groups Direct Cost Groups (Bases) Building Depreciation (F) Instruction and Dept Research (Inst) ORGANIZED RESEARCH (OR) Equipment Depreciation (F) Interest (F) Other Sponsored Activity (OSA) Operations and Maintenance (F) Other Institutional Activity (OIA) General Administration (A) Departmental Administration (A) Sponsored Project Administration (A) Student Service Administration (A) Library (F) Exclusions
Building Depreciation F&A Cost Groups Equipment Depreciation Interest Operations and Maintenance General Administration Departmental Administration Sponsored Project Administration Student Service Administration Library Numerator OR Denominator Inst OSA OIA
FY2021F&A Rate by Component Negotiated Rate til FY22 Negotiated Rate beg. FY23 Proposal Uncapped Proposal Capped 5.8% 2.2% Facilities: Building Depreciation (BD) Equipment Depr (ED) Interest (Int) Oper & Maint (O&M) Library (Lib) Subtotal Facility 5.8% 2.2% .5% 23.1% 3.6% 35.2% 4.2% 1.6% 0.7% 18.9% 3.1% 28.5% 4.9% 1.8% 0.4% 19.3% 3.1% 29.5% .5% 23.1% 3.6% 35.2% Administrative: General Admin (GA) Departmental Admin (DA) Sponsored Programs Admin (SPA) Subtotal Admin 6.7% 17.4% 6.1% 15.9% 4.9% 17.1% 6.1% 15.9% 4.4% 28.5% 4.0% 26.0% 4.0% 26.0% 4.0% 26.0% Total F&A Rate 63.7% 61.2% 54.5% 55.5%
FY2024 F&A Recoveries versus F&A Overhead Expenditures Total $ 108.78 Recoveries Expenditures $ 153.36 Under Recovery $ (44.58) * Amounts in millions
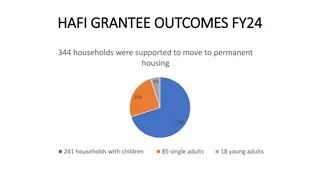
F&A Recoveries Generated by Each College FY2024 Total College/Unit Recoveries $ 14,235,259 $ 267,441 $ 1,803,638 $ 1,703,913 $ 10,051,571 $ 133,208 $ 61,277,450 $ 919,768 $ 1,494,187 $ 10,974,468 $ 5,923,988 $ 108,784,891 Liberal Arts Business Dentistry Education Engineering Law Medicine Nursing Pharmacy Public Health Non-Collegiate TOTAL
Distribution of Recoveries Effort is made by Central Administration to return the recoveries to where the expense occurred. FY24 = $108.8M Distribution General Education Fund = $71.3M Research Facility Funds = $12.2M UIHC = $4.8M TTI Plant Fund = $11.2M Oakdale Campus = $0.7M Clinical Trials = $5.7M VPR = $2.7 Other = $0.2M
Distribution of Recoveries Every $ of recovery is distributed the same in FY24: General Education Fund = 69.22% Research Facility Funds = 11.99% UIHC = 4.78% TTI Plant Fund = 10.93% Oakdale Campus = 0.66% Hygienic Lab = 0.02% VPR = 2.40%
Calculation of UIHC Distribution % O&M Total Rate 19.3 55.5 UIHC O&M Total O&M 5,268,490 38,352,497 O&M % of Total Rate 34.77% UIHC % of Total O&M 13.74% O&M % of Total Rate x UIHC % of Total O&M = 4.78%

")