Factors Driving Filing Compliance in Taxation
Explore the key factors influencing tax filing compliance, including income thresholds, special taxes, and enforcement risks. Learn about nonfiling tax gaps and strategies to improve voluntary filing rates.
Download Presentation

Please find below an Image/Link to download the presentation.
The content on the website is provided AS IS for your information and personal use only. It may not be sold, licensed, or shared on other websites without obtaining consent from the author. If you encounter any issues during the download, it is possible that the publisher has removed the file from their server.
You are allowed to download the files provided on this website for personal or commercial use, subject to the condition that they are used lawfully. All files are the property of their respective owners.
The content on the website is provided AS IS for your information and personal use only. It may not be sold, licensed, or shared on other websites without obtaining consent from the author.
E N D
Presentation Transcript
What Drives Filing Compliance? Brian Erard (B. Erard & Associates) and John Guyton, Pat Langetieg, Mark Payne, and Alan Plumley (IRS RAAS)* *The views expressed in this presentation are those of the authors and do not necessarily represent the opinion of the IRS
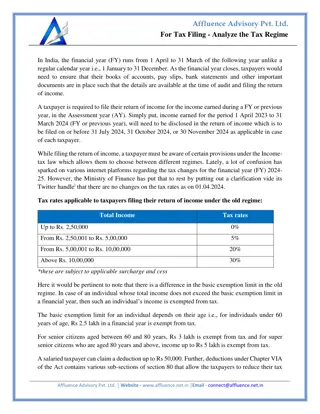
Filing Requirements Not everyone is required to file a tax return One is required to file if Income is above a threshold that varies according to filing and dependency status Owe special taxes (AMT, social security tax on unreported tips, recapture taxes, etc.) Have net self-employment earnings of more than $400 Received advance premium tax credits payments Certain other special cases
IRS Concepts: Nonfilers and Voluntary Filing Rate Nonfiler (Ghost) Return is required but not filed in a timely manner Concept includes late filers who eventually file on their own or in response to enforcement action Voluntary Filing Rate (VFR) Ratio of timely filed required returns to total required returns in the population
Individual Income Tax Voluntary Filing Rate (VFR), Tax Years 2000-2012
Nonfiling Tax Gap Individual income tax gap Individual income taxes owed by taxpayers but not paid in a timely manner Individual nonfiling tax gap Portion of the individual income tax gap attributable to net taxes owed by nonfilers $26 billion per year 8.15% of overall individual income tax gap Nonfiling also accounts for an estimated $4 billion per year in unpaid self-employment taxes
What Drives Filing Compliance? Some potential factors: Filing burden Balance due/refund Potential for refundable credits Income level State income tax filing requirement Enforcement risk/Income visibility Demographics, attitudes, tax knowledge
Traditional Approach to Examining the Drivers of Behavior Qualitatitive Choice Model of Participation ? = 1 Participant Non participant ? = ? ? + ? 0 Estimate model using method of maximum likelihood (logit, probit, etc.) Then interpret estimate coefficients ? to understand the how the various drivers ?impact participation behavior.
Problem with Traditional Approach For a traditional logit or probit analysis, we would require: 1. A representative sample of both filers and nonfilers 2. An indicator for filing status We can draw a representative sample of filers from tax return data, but this sample would only include filers Requirement 1 not satisfied We can draw a representative sample of both filers and nonfilers from a Census survey, but this sample would not identify which respondents filed and which did not file Requirement 2 not satisfied
Calibrated Qualitative Choice Framework As with a standard probit or logit model, let the conditional probability of filing be: ? File = 1 ?? = ?(? ??) The relationship between the VFR and the conditional probability of filing is: ???(? ??), ??? = ?? ?? where ?? is the joint probability distribution of ??.
Probability of Inclusion in a Filer-Only Sample Suppose we were to draw only a representative sample of filers. The probability that a taxpayer with characteristics ??? would be included in such a sample is: = (???)?(? ???) ??? Pr(??= ???) Pr(file|???) Pr(file) , The numerator represents the joint probability that a taxpayer would both file and have these characteristics, while the denominator represents the unconditional probability of filing in the population (i.e., the VFR). The denominator of the above expression accounts for the fact that the sample is restricted only to filers.
Estimation if ?? Were Known Rather remarkably, if we knew ??, the joint distribution of ??, we could actually estimate our model based on a filer- only subsample. The likelihood function would be: ?1?(? ???) ??? = . ?=1 So we would solve: ?1 ln[?(? ???)] max ? ?=1 subject to the constraint: ???(? ??) ??? = ?? ??
Estimation When ?? is Unknown To impose the constraint in the preceding optimization problem: ???(? ??), ??? = ?? ?? one would need to know ??, which is implausible. To address this problem, we replace the exact constraint with its analog constructed from a supplementary random sample of filers and nonfilers based on the CPS: ?2 1 ?2 ?=1 ???(? ???) ??? =
Calibrated Qualitative Choice Model So we solve: ?1 ln[?(? ???)] max ? ?=1 subject to the constraint: ?2 1 ?2 ?=1 ???(? ???), ??? = where ?1is the size of our filer-only sample from tax returns, ?2is the size of our CPS-based supplementary sample of filers and nonfilers, and ? is the CPS sample weight. Notice that the selected value of ? is calibrated to ensure that the average predicted probability in the supplementary sample is consistent with the VFR; hence the name Calibrated Qualitative Choice Model .
Pooling Cross-Sections We estimate our model using a time series of cross-sections covering tax year 2000 through tax year 2012. So we actually solve: ? ?1?ln[?(? ????)] max ? ?=1 ?=1 subject to the ? constraints: ?2? 1 ????(? ????) ????= ? = 1, ,? ?2? ?=1
Some Issues We need to restrict the CPS sample to required returns Done based on our team s prior work in measuring the VFR Explanatory variables need to be present in both data sources This rules out certain variables, such as presence of a refund/balance due The explanatory variables also need to be consistently measured across the two data sources Rules out some additional variables, such as filing status and earned income credit eligibility
Key Findings Demographics Filing is more relatively likely if elderly and less likely if married Income Filing is positively associated with gross income and negatively associated with being self-employed Filing is relatively less likely if gross income is near the filing threshold Burden Filing is negatively associated with the burden of preparing and filing a return, but less so near filing threshold
Key Findings, Continued Incentives Economic Stimulus Controlling for other factors, filing increased by about 1 percentage point in tax year 2007 in response to the Economic Stimulus, but the impact was temporary. Expanded EIC for 3 or more children Controlling for other factors, filing increased among households with 3 or more children from tax year 2009 on (period with extra earned income credit for 3rdchild).
Future Work We recently discovered that our estimates of the VFR over the estimation period were too high. Our preliminary results based on improved estimates covering a shorter estimation period are qualitatively similar to our initial findings. We have been working to generalize our framework to account for prior-year filing behavior. Our preliminary results indicate that having filed a prior-year return increases the likelihood of filing in the current year by 43 percentage points.

