Stay updated on the partnership's bi-annual meeting discussing important topics like integrating housing departments, COVID-19 response, state-wide data projects, and service provider updates to prevent and end homelessness in the Fairfax-Falls Church area.
Please find below an Image/Link to download the presentation.
The content on the website is provided AS IS for your information and personal use only. It may not be sold, licensed, or shared on other websites without obtaining consent from the author. If you encounter any issues during the download, it is possible that the publisher has removed the file from their server.
You are allowed to download the files provided on this website for personal or commercial use, subject to the condition that they are used lawfully. All files are the property of their respective owners.
The content on the website is provided AS IS for your information and personal use only. It may not be sold, licensed, or shared on other websites without obtaining consent from the author.
E N D
Presentation Transcript
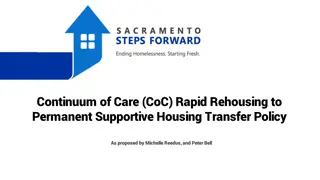
FAIRFAX-FALLS CHURCH COMMUNITY Partnership to Prevent and End Homelessness BI-ANNUAL COC MEETING July 7th, 2020 | 10:30 12:00 PM Virtual Meeting RAISE HAND MICROPHONE CHAT VIDEO
AGENDA 1) Integration of Fairfax County s Department of Housing & Community Development (HCD) and the Office to Prevent and End Homelessness 2) Homeless Services System Updates Summary of the Response to COVID-19 3) Virginia Department of Housing & Community Development Homeless and Special Needs Housing (HSNH) State-wide HMIS Data Integration Project 4) Homeless Services System Data 2020 Point in Time & Housing Inventory Counts HUD System Performance Measures 5) Updates from Providers
INTEGRATION OF Fairfax County s Department of Housing & Community Development (HCD) and Fairfax County s Department of Housing & Community Development (HCD) and Fairfax County s Office to Prevent and End Homelessness Fairfax County s Office to Prevent and End Homelessness
RESPONSE TO COVID-19 215 HOTEL ROOMS 04.02.20: FEMA reimbursement funding secured for the payment of hotels ESG-CV award of $1,699,586 announced by HUD 04.16.20: QPID Hotel Sites open in Falls Church, operated by Shelter House April 20th 100 HOTEL ROOMS 05.02.20: ESF6 Workgroup, collaboration of 6 Fairfax County Departments was created 05.11.20: Decompression implemented at shelters to ensure ongoing social distancing 05.26.20: QPID Hotel Site opens in Herndon, operated by Cornerstones 87 HOTEL ROOMS 06.05.20: QPID Hotel Site opens in Alexandria, operated by New Hope Housing June 10th QPID Hotel Site opens in Alexandria, operated by FACETS June 12th 06.09.20: ESG-CV award of $6,581,782 announced by HUD 06.17.20: Central Intake implemented, operated by Northern Virginia Family Service 57 HOTEL ROOMS 6 HOTELS | 459HOTEL ROOMS | 50 DAYS
RESPONSE TO COVID-19 7 Fairfax County Health and Human Service Departments Coordinated Services Planning (CSP) Department of Family Services (DFS) Fairfax-Falls Church Community Services Board (CSB) Health Department (HD) Office of Emergency Management (OEM) Office to Prevent and End Homelessness (OPEH) Office of Strategy Management (OSM) 5 Non-profit providers operating Hotels/Central Intake Cornerstones FACETS New Hope Housing Northern Virginia Family Service Shelter House 2 Federally Qualified Health Care Centers (FQHCs) HealthWorks Neighborhood Health 4 Free Clinics Culmore Clinic Local Hospitals 25+ PARTNERS
RESPONSE TO COVID-19 250+ CLIENTS PLACED IN QUARANTINE, PROTECTION, ISOLATION, DECOMPRESSION (QPID) HOTELS
STATE-WIDE HMIS DATA INTEGRATION PROJECT ANDRIEA UKRO ANDRIEA UKROP | P | Homeless Data Integration Coordinator Homeless Data Integration Coordinator
2020 POINT IN TIME COUNT Point-in-Time Count (PIT):count of sheltered and unsheltered homeless persons 2020 PIT = January 22, 2020 Unsheltered Emergency Shelter (DV Shelter, Overflow - Hotels & Winter Seasonal, Hypothermia Programs) Transitional Housing 2019 PIT: 1,034 people experiencing homelessness 2020 PIT: 1,041 people experiencing homelessness (1% increase, 7 people) 21 AGENCIES (PIT & HIC) | 97 PROJECTS
2020 POINT IN TIME COUNT Point in Time Count 2017 - 2020 (4 Year Trend) Point in Time Count 2008 - 2020 (12 Year Trend) 1835 1730 1549 1544 1534 1350 1225 1041 1204 1034 1091 1067 987 964 1059 1041 1034 987 964 892 883 837 744 747 715 697 695 663 666 528 526 652 513 508 499 490 603 488 474 577 528 513 530 526 508 499 488 490 482 489 474 2017 2018 2019 2020 2008 2009 2010 2011 2012 2013 2014 2015 2016 2017 2018 2019 2020 SINGLE INDIVIDUALS PEOPLE IN FAMILIES WITH CHILDREN TOTAL Linear (TOTAL) 43% reduction in the number of people experiencing homelessness since the 2008 PIT Consistent decrease started in 2011 PIT Counts increased for the past four consecutive years (2017 2020) 964 people experiencing homelessness in the 2017 PIT Count 1,041 people experiencing homelessness in the 2020 PIT Count, an increase of 8%
2020 HOUSING INVENTORY COUNT Emergency Shelter 396 BEDS, 15% PROJECT TYPE BEDS Permanent Housing - OPH 482 BEDS, 19% ES 833 Emergency Shelter - DV 98 BEDS, 4% TH 247 RRH 366 Permanent Housing - PSH 627 BEDS, 25% Emergency Shelter - Hypothermia/Winter Seasonal 273 BEDS, 11% PSH 627 OPH 482 TOTAL BEDS 2555 Emergency Shelter Hotels (Overflow) 49 BEDS, 2% PROJECT TYPE PEOPLE Sheltered PIT Count 953 Emergency Shelter Medical Respite 9 BEDS, <1% Unsheltered PIT 88 TOTAL PIT Count 1041 Permanent Housing - DV RRH 88 BEDS, 3% Transitional Housing BEDS 152, 6% TOTAL PIT Housed 1430 Permanent Housing - RRH 278 BEDS, 11% TOTAL PEOPLE 2471 Transitional Housing - DV 95 BEDS, 4%
SYSTEM PEFORMANCE MEASURES Measure 1: Length of Time Persons Remain Homeless Measure 2: The Extent to which Persons who Exit Homelessness to Permanent Housing Destinations Return to Homelessness within 6, 12, and 24 Months Measure 3: Number of Homeless Persons Measure 4: Employment and Income Growth for Homeless Persons in CoC Program-funded Projects Measure 5: Number of Persons who Homeless for the First Time Measure 6: Homelessness Prevention and Housing Placement of Persons Defined by Category 3 of HUD s Homeless Definition in CoC Program-funded Projects Measure 7a: Successful Placement from Street Outreach Measure 7b: Successful Placement in or Retention of PH
SYSTEM PERFORMANCE MEASURE #3 Number of persons experiencing homelessness RARE RARE BRIEF ONE TIME METRIC 3.1 CHANGE IN PIT COUNTS | METRIC 3.2 CHANGE IN ANNUAL COUNTS PIT COUNT PIT COUNT 7% INCREASE BETWEEN 2017 & 2019 PIT & ANNUAL COUNTS ANNUAL COUNT ANNUAL COUNT 6% INCREASE BETWEEN 2018 & 2019 Point-in-Time Count (Street Outreach, Emergency Shelter, & Transitional Housing) Annual Count (Emergency Shelter & Transitional Housing) 3118 3043 3118 3043 2808 2968 2808 1059 1059 1034 987 964 987 964 2016 2017 2018 2019 2016 2017 2018 FEDERAL FISCAL YEAR: 10/01 09/30
SYSTEM PERFORMANCE MEASURE #5 First time homelessness RARE RARE BRIEF ONE TIME METRIC 5.1 CHANGE IN THE # OF PERSONS IN ES+TH WITH NO PRIOR ENROLLMENTS IN HMIS FIRST TIME HOMELESS FIRST TIME HOMELESS 7% DECREASE BETWEEN 2016 & 2018 FIRST TIME HOMELESSS Emergency Shelter & Transitional Housing 2% INCREASE BETWEEN 2018 & 2019 1901 1838 1737 1704 2016 2017 2018 2019 FEDERAL FISCAL YEAR: 10/01 09/30
SYSTEM PERFORMANCE MEASURE #7 Exits to permanent housing RARE BRIEF ONE TIME ONE TIME METRIC 7B.1 CHANGE IN PERSONS EXITING TO PERMANENT HOUSING PERMANENT HOUSING RETENTION PERMANENT HOUSING RETENTION 1% INCREASE BETWEEN 2018 & 2019 PERCENT EXITING TO PERMANENT HOUSING ES ES +TH 9% INCREASE BETWEEN 2018 & 2019 TH + RRH TO PERMANENT RRH TO PERMANENT Exiting from Permanent Housing (excluding Rapid Rehousing) OR retaining permanent housing Exiting from Emergency Shelter, Transitional Housing, & Rapid Rehousing Exiting from Street Outreach STREET OUTREACH TO PERMANENT STREET OUTREACH TO PERMANENT 64% INCREASE BETWEEN 2018 & 2019 98% 97% 96% 92% 54% 48% 45% 44% 48% 39% 33% 33% 2016 2017 2018 2019 FEDERAL FISCAL YEAR: 10/01 09/30
SYSTEM PERFORMANCE MEASURE #1 Length of time persons remain homeless RARE BRIEF BRIEF ONE TIME METRIC 1.1 EMERGENCY SHELTER AVERAGE LENGTH OF STAY AVERAGE LENGTH OF STAY 34% INCREASE BETWEEN 2016 & 2019 NUMBER OF PERSONS SERVED AVERAGE LENGTH OF STAY (DAYS) NUMBER OF PERSONS SERVED NUMBER OF PERSONS SERVED 6% DECREASE BETWEEN 2018 & 2019 2831 2828 2723 2573 82 71 63 61 2016 2017 2018 2019 2016 2017 2018 2019 INCLUDES HYPOTHERMIA FEDERAL FISCAL YEAR: 10/01 09/30
FAIRFAX-FALLS CHURCH COMMUNITY Partnership to Prevent and End Homelessness THOUGHTS, QUESTIONS, OR IDEAS ABOUT COC MEETINGS? JAMIE ERGAS, LMSW Continuum of Care Manager Office to Prevent and End Homelessness Department of Housing & Community Development Direct: 703-324-3240 Cell: 703-223-2003 jamie.ergas@fairfaxcounty.gov