False Discoveries in Financial Economics: Insights by Campbell R. Harvey
Explore a series of false and missed discoveries in financial economics as presented by Campbell R. Harvey and Yan Liu. The investment management seminar highlights impressive trading strategy performance, factors influencing financial models, and the quest to identify luck from skill in financial research.
Download Presentation

Please find below an Image/Link to download the presentation.
The content on the website is provided AS IS for your information and personal use only. It may not be sold, licensed, or shared on other websites without obtaining consent from the author. If you encounter any issues during the download, it is possible that the publisher has removed the file from their server.
You are allowed to download the files provided on this website for personal or commercial use, subject to the condition that they are used lawfully. All files are the property of their respective owners.
The content on the website is provided AS IS for your information and personal use only. It may not be sold, licensed, or shared on other websites without obtaining consent from the author.
E N D
Presentation Transcript
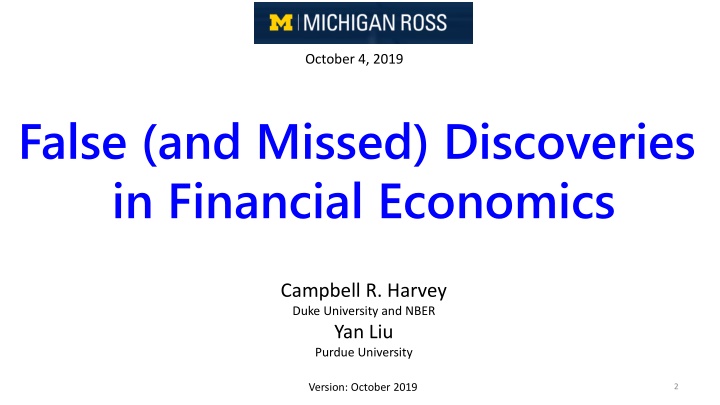
October 4, 2019 False (and Missed) Discoveries in Financial Economics Campbell R. Harvey Duke University and NBER Yan Liu Purdue University Version: October 2019 2
Investment management seminar Performance of trading strategy is very impressive. SR=1; t-stat=3.4 Consistent No financial crisis Drawdowns acceptable Source: Man AHL Campbell R. Harvey 2019 3
Investment management seminar Source: Man AHL Campbell R. Harvey 2019 4
Investment management seminar Sharpe = 1 Sharpe = 2/3 Sharpe = 1/3 200 random time-series mean=0; volatility=15% Source: Man AHL Campbell R. Harvey 2019 5
Factors everywhere 5 factors Campbell R. Harvey 2019 6
Factors everywhere 15 factors Campbell R. Harvey 2019 7
Factors everywhere 82 factors Campbell R. Harvey 2019 8 Source: The Barra US Equity Model (USE4), MSCI (2014)
Factors everywhere 400 factors Source: https://www.capitaliq.com/home/who-we-help/investment-management/quantitative-investors.aspx Campbell R. Harvey 2019 9
Factors everywhere 18,000factors! Yan and Zheng (2017) Campbell R. Harvey 2019 10
Factors everywhere 2.1 million! Campbell R. Harvey 2019 11
Factors everywhere 100 million!? the company has four million alphas to date and is aiming for 100 million. Campbell R. Harvey 2019 12
A framework to separate luck from skill Six research initiatives: 1. Explicitly adjust for multiple tests ( ) [RFS 2016] 2. Bootstrap ( Lucky Factors ) [in review, 2019] 3. Noise reduction ( Detecting Repeatable Performance ) [RFS2018] 4. Rare effects ( Presidential Address ) [JF 2017] 5. Idiosyncratic noise ( Alpha dispersion ) [JFE 2019] 6. False (and missed) discoveries [in review, 2019] Campbell R. Harvey 2019 13
A framework to separate luck from skill Six research initiatives: 1. Explicitly adjust for multiple tests ( ) [RFS 2016] 2. Bootstrap ( Lucky Factors ) [in review, 2019] 3. Noise reduction ( Detecting Repeatable Performance ) [RFS2018] 4. Rare effects ( Presidential Address ) [JF 2017] 5. Idiosyncratic noise ( Alpha dispersion ) [JFE 2019] 6. False (and missed) discoveries [in review, 2019] Campbell R. Harvey 2019 14
1. Multiple Tests Provide a new framework to do multiple tests in the presence of correlations among tests and publication bias (hidden tests) Provide guidelines for future research Campbell R. Harvey 2019 15
1. Multiple Tests: Number of Factors and Publications Campbell R. Harvey 2019 16
1. Multiple Tests: Rewriting History Campbell R. Harvey 2019 17
1. Multiple Tests: Harvey, Liu and Zhu Approach Allows for correlation among strategy returns Allows for missing tests Review of Financial Studies, 2016 Campbell R. Harvey 2019 18
2. Bootstrapping Create a database of manager returns For every manager, strip out their average performance (so every manager has zero excess return relative to benchmark) Create a new history by randomly sampling months (with replacement) Average returns will not be zero Record the best performer (note this best performance is purely by luck given we have hardwired no skill) Campbell R. Harvey 2019 21
2. Bootstrapping Create a database of manager returns Repeat the process In the real data, the manager needs to beat what we can get purely by luck by creating these alternative histories with unskilled manager returns Campbell R. Harvey 2019 22
3. Noise reduction Issue Past alphas do a poor job of predicting future alphas (e.g., top quartile managers are about as likely to be in top quartile next year as this year s bottom quartile managers!) Campbell R. Harvey 2019 23
3. Noise reduction Issue This could be because all managers are unskilled or it could be a result of a lot of noise historical performance Campbell R. Harvey 2019 24
3. Noise reduction Goal Develop a metric that maximizes cross-sectional predictability of performance Campbell R. Harvey 2019 25
3. Noise reduction Method: Combine individual performance with cross-manager performance with modified EM algorithm It is possible that a manager just gets really lucky we reduce that alpha using the cross-manager information Campbell R. Harvey 2019 27
3. Noise reduction Campbell R. Harvey 2019 28
3. Noise reduction Method: My research shows that the Noise Reduced Alphas do a much better job of predicting future alphas than the regular alpha So there is information in past returns (noise adjusted) that are useful for forecasting future returns Campbell R. Harvey 2019 29
3. Noise reduction Campbell R. Harvey 2019 30
3. Noise reduction Review of Financial Studies, 2018 Campbell R. Harvey 2019 31
4. Rare effects: Presidential address Approach Develop a simple mathematical framework to inject prior beliefs (Minimum Bayes Factor) Here is an example of a top five factor in the 2-million factor paper! (CSHO-CSHPRI)/MRC4 Campbell R. Harvey 2019 32
4. Rare effects: Presidential address Example In words: (Common Shares Outstanding Common Shares Used to Calculate EPS) Campbell R. Harvey 2019 33
4. Rare effects: Presidential address Example In words: (Common Shares Outstanding Common Shares Used to Calculate EPS) Rental Commitments 4th year New technique adjusts Sharpe ratios by injecting how much confidence you have in the plausibility of the effect. Campbell R. Harvey 2019 34
5. Cross-sectional alpha dispersion Suppose two groups of funds: skilled and unskilled If there was very little dispersion in performance, it should be easy to detect who is skilled and unskilled If funds take on a lot of idiosyncratic risk, the dispersion will increase making it easy for a bad fund to masquerade as a good fund Our evidence shows that investors have figured it out hurdle for declaring a fund skilled increases when lots of dispersion Campbell R. Harvey 2019 35
6. False (and missed) discoveries Lots of false discoveries when a cut off of t>2 is used Various corrections in Harvey, Liu and Zhu (2016) impose a higher threshold However, it is unknown what the error rate is (we only know it is lower than t=2) Campbell R. Harvey 2019 36
6. False (and missed) discoveries In addition: Current statistical tools rely on a binary classification (all false discoveries are simply counted to get the error rate ignoring the magnitude of the mistake) Research in financial economics pays little attention to power (ability to identify truly skilled managers) There is no work on the relative costs of Type I and Type II errors Campbell R. Harvey 2019 37
6. False (and missed) discoveries Explicitly calibrate the Type I (hiring a bad manager, choosing a false factor) and Type II (missing a good manager) rates given the data using a novel double bootstrapping method We are able to accommodate the magnitude of the error not just a binary classification Our framework enables a new decision rule: e.g., To avoid a bad manager, I am willing to miss five good managers Campbell R. Harvey 2019 38
6. False (and missed) discoveries Preview Fama and French (2010) conclude that they cannot reject the hypothesis that no mutual fund outperforms (consistent with market efficiency) We show that the application of their technique to mutual funds has close to zero power (they are unable to identify truly skilled managers) With the application of our method, the narrative changes Campbell R. Harvey 2019 39
6. False (and missed) discoveries Single test Control for Type I error at a certain level (5%), while seeking methods that generate low Type II errors (high power) Type I error: Assume null is true and calculate the probability of false discovery Type II error: Assume a certain level for parameter of interest, say, 0, calculate the probability of false negative as a function of 0 Campbell R. Harvey 2019 40
6. False (and missed) discoveries Multiple tests Type I error: null holding true for every fund seems unrealistic. We need alternative definitions (like False Discovery Rate). We provide data-driven statistical cutoff. Type II error: Depends on parameters of interest which is a high dimensional vector with multiple tests. Not clear what the value of this vector is. We propose a simple way to summarize the parameters of interest. Campbell R. Harvey 2019 41
6. False (and missed) discoveries Multiple tests: Issue 1 Given the difficulty with Type II errors, most research focuses on Type I errors E.g., Harvey, Liu and Zhu (2016) focus on FWER (family-wise error rate, the probability of making at least one false discovery) and the FDR (false discovery rate, expected fraction of false discoveries) Properties of Type II errors unknown Campbell R. Harvey 2019 42
6. False (and missed) discoveries Multiple tests: Issue 2 While we can calculate Type I and II errors analytically with single testing under certain assumptions, these assumption are difficult to adapt to a multiple testing framework For example, how do we measure the cross-sectional dependence among tests? Campbell R. Harvey 2019 43
6. False (and missed) discoveries Multiple tests: Issue 3 Current methods do not model the magnitude of the errors, instead they use a binary classification Current methods do not allow for differential costs of Type I and Type II errors Campbell R. Harvey 2019 44
6. False (and missed) discoveries Method N strategies and D time periods: Data matrix X0 (DxN) Suppose you believe that proportion p0are skilled Special case is Fama and French (2010) and Kosowski et al. (2010) where p0=0 Campbell R. Harvey 2019 45
6. False (and missed) discoveries Method When p0>0, some strategies believed to be true, then p0 acts like a plug in parameter (similar to 0) that helps us measure the error rates in terms of multiple testing. In multiple testing, we need to make assumptions on population statistics that are believed to be true in order to determine error rates In our framework, p0 is a single summary statistic that allows us to evaluate errors without conditioning on the values of population statistics Campbell R. Harvey 2019 46
6. False (and missed) discoveries Method: Bayesian interpretation HLZ present a Bayesian framework for multiple testing where the adjustment is made via the likelihood function. Harvey (2017) recommends minimum Bayes factor (abstracts from the prior specification by focusing on the prior that generates the MBF). Campbell R. Harvey 2019 47
6. False (and missed) discoveries Method: Sort the N strategies by t-statistics p0x N are deemed skilled (1-p0) x N unskilled Create a new data matrix where we use the p0 x N actual excess returns concatenated with (1-p0) x N returns that are adjusted to have zero excess performance Y=[X0,1 | X0,0] Campbell R. Harvey 2019 48
6. False (and missed) discoveries Method: Bootstrap 1 Bootstrap Y=[X0,1 | X0,0] and create a new history by randomly sampling (with replacement) rows. Given a t-statistic cutoff, by chance some of the unskilled will show up as skilled and some of the skilled as unskilled At a various level of t-statistics, we can count the Type I and Type II errors (or take the magnitudes into account). Repeat for 10,000 bootstrap iterations Campbell R. Harvey 2019 49
6. False (and missed) discoveries Method: Bootstrap 1 Averaging over the iterations, we can determine the Type I error rate at different levels of t-statistic thresholds It is straightforward to find the level of t-statistic that delivers a 5% error rate Type II error rates are easily calculated too Campbell R. Harvey 2019 50
6. False (and missed) discoveries Method: Bootstrap 2 This method is flawed. Our original assumption is that we know the p0 skilled funds and we assign their sample performance as the truth that is, some of the funds we declare skilled are not. We take a step back. Campbell R. Harvey 2019 51
6. False (and missed) discoveries Method: Bootstrap 2 With our original data matrix X0, we perturb it by doing an initial bootstrap, i. With perturbed data, we follow the previous steps and bootstrap Yi=[X0,1 | X0,0] This initial bootstrap is essential to control for sampling uncertainty; we repeat it 1,000 times This is what we refer to as double bootstrap Campbell R. Harvey 2019 52
6. False (and missed) discoveries Method: Bootstrap 2 Bootstrap allows for data dependence Allows us to make data specific cutoffs Allows us to evaluate the performance of different multiple testing adjustments, e.g., Bonferroni Campbell R. Harvey 2019 53
6. False (and missed) discoveries Application 1a: S&P CapIQ factor data 484 backtest strategies (includes periods when strategy not known) 22% have t-stats > 2.0 54 Campbell R. Harvey 2019

