Fault Management with OpenStack Congress and Vitrage
This presentation explores fault management strategies using OpenStack Congress and Vitrage within the OPNFV Doctor framework. It covers failure inspection, virtualized platform visualization, definition of failure, fault management architecture, state correction APIs, and Inspector Module options in the context of network and power supply topologies. Various tools and techniques are discussed for effective fault handling.

Download Presentation

Please find below an Image/Link to download the presentation.
The content on the website is provided AS IS for your information and personal use only. It may not be sold, licensed, or shared on other websites without obtaining consent from the author.If you encounter any issues during the download, it is possible that the publisher has removed the file from their server.
You are allowed to download the files provided on this website for personal or commercial use, subject to the condition that they are used lawfully. All files are the property of their respective owners.
The content on the website is provided AS IS for your information and personal use only. It may not be sold, licensed, or shared on other websites without obtaining consent from the author.
E N D
Presentation Transcript
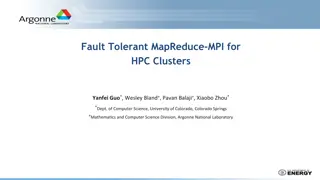
Fault Management with OpenStack Congress and Vitrage, Based on OPNFV Doctor Framework Barcelona 2016 Ryota Mibu NEC Ohad Shamir Nokia Masahito Muroi NTT
Contents Failure Inspection in OPNFV Doctor - Ryota OpenStack Vitrage - Ohad OpenStack Congress - Masa
Virtualized Platform VM VM VM Volume Port Port Port Volume Net Net H/W Switch H/W Switch PM PM
Virtualized Platform VM VM VM X Volume X Port Port Port Volume Net Net H/W Switch H/W Switch PM PM
What is failure? Depends on Applications (VNFs) Back-end technologies used in the deployment Redundancy of the equipment/components Operator Policy Regulation Topologies of Network / Power-supply So, failure has to be configurable 6
Fault Management Architecture Designed by Doctor Project 0. Set Alarm Applications Manager 6-. Action 5. Notify Error 4. Notify all Controller Controller Notifier Nova Alarm Conf. Controller Neutron Resource Map Ceilometer+Aodh Cinder Virtualized Infrastructure 4. (alt) Notify 3. Update State 2. Find Affected Monitor Monitor Inspector Monitor Failure Policy Congress 1. Raw Fault Vitrage 7
State Correction APIs Nova Reset Server State POST /servers/{server_id}/action { "os-resetState": { "state": error" } } Update Forced Down PUT /os-services/force-down { "host": "host1", "binary": "nova-compute", "forced_down": true } Neutron Update port data plane status WIP https://review.openstack.org/351675/ PUT /v2.0/ports/<port-uuid> { "port": { "dp_down": true } } Cinder Reset a volume's statuses POST /volumes/{volume_id}/action { "os-reset_status": { "status": "available", "attach_status": "detached", "migration_status": "migrating" } }
Inspector Module Options OpenStack Vitrage Various data source (OpenStack, Nagios, etc.) Ability to store and refer physical topologies for correlation Holistic & complete view of the system OpenStack Congress Dynamic data collection from OpenStack services Flexible policy definition for correlation (Datalog) Well integrated with other OpenStack projects
Stained glass art produced through the combination of brilliantly colored glass in varying degrees of transparency, creating a dynamic art form which is transformed with every variation in light
Vitrage in a nutshell Official OpenStack project for Root Cause Analysis Vitrage Functions Root Cause Analysis understand why faults occurred Deduced alarms and states raising alarms and modifying states based on system insights Holistic & complete view of the system
Vitrage Architecture Highlights Multiple Easily extendible to add new data sources Data sources Entity Topology Graph Reflects how entities relate to one another Configurable business logic Template-based behavior
Vitrage High Level Architecture Expose Vitrage alarms and state changes to other projects or external systems Horizon Plug-in: - Hierarchical view - Vitrage alarm list - RCA diagram per alarm - Entity graph view - Templates list Multiple Data Sources (extendible): - External monitoring tools: Nagios, Zabbix - OpenStack projects - Physical topology Templatesfor deduced alarms and RCA: - Each template can contain one or more scenarios (scenario = condition + action) - Human readable - Configurable
Vitrage Template Template contains three sections: 1) Metadata name, description of template 2) Definitions entities & relationships 3) Scenarios conditions & actions Each template can contain one or more scenarios (condition + action/s) YAML format, human readable Configurable
Template Example Host high CPU load Scenario 3 Set host state Scenario 1 Raise Alarm Scenario 2 RCA When high CPU load on host, set host state to suboptimal When high CPU load on host and host contains instance: 1. Raise deduced alarm on instance named cpu performance degradation 2. Set state to suboptimal on instance When high CPU load on host and host contains instance and cpu performance degradation alarm on instance, add causal relationship
Template Example Host high CPU load Raise alarm on VM (deduced alarm and state) 1 Add causal relationship 2 Set host state 3
How does it work? Entity Graph + Evaluator Vitrage Evaluator listens to change events in the entity graph and upon event: Retrieve templates (scenarios) relevant to event Evaluate condition against the state of the Entity Graph Execute actions for each matched condition E C A A A B B B C B Sub-graph Matching F C C F A C G G G
Lets see Vitrage
Vitrage as Doctor Inspector Push and pull interfaces to various monitoring tools (e.g. Nagios, Zabbix) and to OpenStack projects -> fast failure notification Mapping between physical and logical failures Expose more faults and changes to resources (deduced alarms and states) Provide Root Cause Analysis indicators to the application manager Can be configured differently for different systems
What is Congress? Governance as a Service Define and enforce policy for Cloud Services Policy No single definition Law/Regulations Business Rules Security Requirements Application Requirements Datalog style policy Goal of Congress Any Service, any Policy 21
Congress Architecture Data Policy Enforcement Policy Monitor in Doctor Policy Congress API Policy Engine Neutron Doctor Nova DataSourceDriver DataSourceDriver DataSourceDriver Neutron Nova 22
Congress Doctor Driver Data Policy Enforcement Doctor data flow Policy 1. Policy Monitor Congress 2. Doctor API DataSourceDriver 4. 3. Policy Engine Neutron Keystone DataSourceDrive r Security System DataSourceDrive r Nova 1. 2. 3. Monitor notifies hardware failure event to Congress Doctor Driver receives failure event, insert it to event list of Doctor Data DataSourceDrive r Policy Engine receives the failure event, then evaluate registered policy and enforce state correction Policy Engine instruct Nova Driver to perform host service force down and reset state of VM(s) DataSourceDriver Security System 4. Neutron Keystone Nova 23
Congress Doctor Driver (Detail) Driver Schema HW failure example +--------+-----------------------------------------------------+ | table | columns | +--------+-----------------------------------------------------+ | events | {'name': 'id', 'description': 'None'}, | | | {'name': 'time', 'description': 'None'}, | | | {'name': 'type', 'description': 'None'}, | | | {'name': 'hostname', 'description': 'None'}, | | | {'name': 'status', 'description': 'None'}, | | | {'name': 'monitor', 'description': 'None'}, | | | {'name': 'monitor_event_id', 'description': 'None'} | +--------+-----------------------------------------------------+ Event List of Doctor Data +----------------+-------------------------------+----------------+---------------+--------+--------------+------------------+ | id | time | type | hostname | status | monitor | monitor_event_id | +----------------+-------------------------------+----------------+---------------+--------+--------------+------------------+ | 0123-4567-89ab | 2016-03-09T07:39:27.230277464 | host.nic1.down | demo-compute0 | down | demo_monitor | 111 | +----------------+-------------------------------+----------------+---------------+--------+--------------+------------------+ 24
Policy for Inspector A hypervisor and instances on the hypervisor must be down state/error status if some errors are reported by Monitor.
Policy of Congress List hypervisors that violate the policy Still in up state even though it s reported error happens binary_list("nova-compute") active_hypervisor(hypervisor, binary):- nova:services(host=hypervisor, binary=binary, status="up"), binary_list(binary), error_reported_hosts(hypervisor) List instances that violate the policy Still in Active status even though it reported error happens active_instance_in_host(vmid, hypervisor):- nova:servers(id=vmid, host_name=hypervisor, status="ACTIVE"), error_reported_hosts(hypervisor)
Policy of Congress How to fix the violation mark host down the hypervisor execute[nova:services.force_down(host, binary, "True")] :- active_compute_hypervisor(host, binary) Set the vm status to error execute[nova:servers.reset_state(vmid, "error")] :- active_instance_in_host(vmid, host)
Scenario 1: sensitive app/operator Defines both non-broken events and broken events as a failure mark_down_events( host.nic1.down') mark_down_events( host.nic2.down') mark_down_events( host.cpu.high-load ) error_reported_hosts(hosts):- doctor:events(hostname=hosts, type=event_t, status= down ), mark_down_events(event_t)
Scenario 2: insensitive app/operator Defines only broken events as a failure mark_down_events( host.nic1.down') mark_down_events( host.nic2.down ) mark_down_events( host.cpu.high-load ) error_reported_hosts(hosts):- doctor:events(hostname=hosts, type=event_t, status= down ), mark_down_events(event_t)


")