Feasibility of Evolving Animal Model in Discovery Study
A proposal was presented for a study of hyperlipidemia in monkeys, with a focus on collaborative critical reassessment and Bayesian insight. The study aims to understand the predictive probability of continuing with hyperlipidemia based on previous data. Various aspects were considered for optimization, including target levels, entrance criteria, monitoring procedures, and decision rules.

Download Presentation

Please find below an Image/Link to download the presentation.
The content on the website is provided AS IS for your information and personal use only. It may not be sold, licensed, or shared on other websites without obtaining consent from the author. If you encounter any issues during the download, it is possible that the publisher has removed the file from their server.
You are allowed to download the files provided on this website for personal or commercial use, subject to the condition that they are used lawfully. All files are the property of their respective owners.
The content on the website is provided AS IS for your information and personal use only. It may not be sold, licensed, or shared on other websites without obtaining consent from the author.
E N D
Presentation Transcript
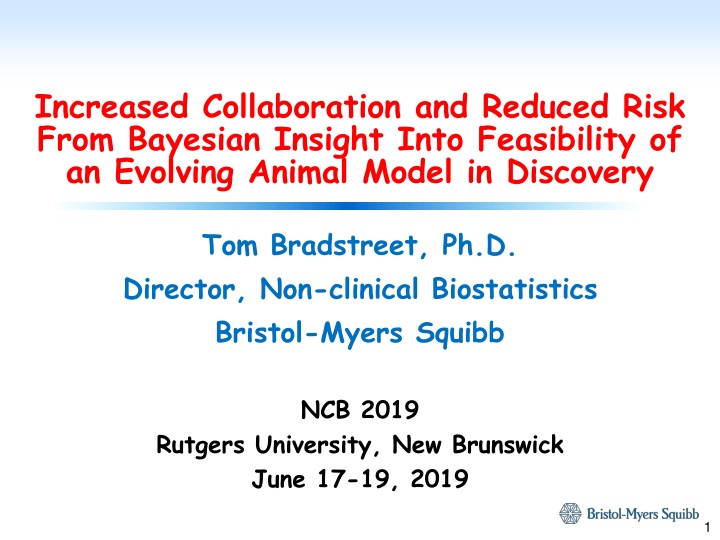
Increased Collaboration and Reduced Risk From Bayesian Insight Into Feasibility of an Evolving Animal Model in Discovery Tom Bradstreet, Ph.D. Director, Non-clinical Biostatistics Bristol-Myers Squibb NCB 2019 Rutgers University, New Brunswick June 17-19, 2019 1
Abstract A proposal was presented for a three-treatment, randomized, parallel, longitudinal, discovery translational medicine study of hyperlipidemia in monkeys. Animals were to enter the study and during the Run-In Period they were to receive a special diet to drive up their lipid levels to a specified target level to qualify to enter the randomized Treatment Period. It was suggested that it would take 30 animals to enter the Run-In Period to qualify at least 24 animals to enter the Treatment Period. Based upon data from 3 previous studies, it was determined that the Predicted Probability of Success (PPoS) in the Run-In Period based upon the initial proposal was unacceptable. Indeed it might take as many as 67 animals to enter the Run-In Period to achieve an acceptable PPoS to qualify 24 animals. Armed with this information, a collaborative critical reassessment of the study and evolving animal model included, but was not limited to: hyperlipidemia target levels, entrance criteria, monitoring procedures, innovative experimental designs, decision rules, lab space, and fiscal constraints. 2
Who is here today? Students Statisticians Frequentists Bayesians Hybrids Not sure? Non-statisticians Quantitative sciences (e.g., data scientists, ) Non-quantitative sciences (e.g., biology, ) Other Affiliation Industry Academia Government Independent consultants 3
Who is here today? How statistically savvy are your discovery, translational research, , collaborators? Presentation is near the original level targeting biological collaborators. concepts visualization interpretation decision making notation 4
Background Three treatment, randomized, parallel, longitudinal, study. Rhesus reaching fructose-induced hyperlipidemia (TGs 150 mg/dL) during Run-In Period continue into a randomized Treatment Period receiving 1 of either 2 or 3 treatments. Three previous external studies External opinion and experience building hyperlipidemia model. External statistical analyses of coarsely pooled continuous scale data from control animals (observed values, change, percent change). Conjecture to start 30 Rhesus in Run-In Period to continue 24 with increased TGs into Treatment Period. Implicit a priori belief that = Pr(TGsRun-In 150 mg/dL) = .80. 5
The Question and Some Answers Question Given the Run-In Period data from the control groups (only) in 3 previous studies, what is the predictive probability of starting 30 Rhesus to continue 24 with hyperlipidemia? Some answers External: Experience / opinion / data analyses ( p<.05 ) Data: 35% to 50% animals achieved candidate absolute and relative Run-In rules, e.g., TGs 150 mg/dL, , 75 mg/dL. Bayesian Feasibility Analysis: Pr( 24 Rhesus continue) = ? yes. 6
Opportunities Increase collaboration and collegial partnership. WE are ALL in this TOGETHER. Innovation Bayesian probability-based risk assessment and decision-making. Mentoring Many collaborators Don t know that they don t know . (TEB) Increase stochastic intelligence and statistical literacy. (TEB) Guide enlightened empiricism , Para-statisticians . (SJH) Query what something IS vs. what something IS NOT . (TEB) Estimation vs. significance / hypothesis testing. Assumptions in science are everything. ( bio-stochastic ) (TEB) It is more important to understand variability than effect size. (TEB) 7
Opportunities 4th R in animal research (TEB) 3 Rs: Reduction, Refinement, Replacement 3 Rs: Reduce, Reuse, Recycle 4th R: RIGHT number of animals considering all information (TEB) Ethical Acuity. How sharply are we addressing ethical issues? Increase responsible use of animals. Increase speed-to-patient. Probabilistic winds are now at our backs instead of unnecessarily blowing in our faces. (TEB) If the winds are unfavorable, at least we will know how much, a priori. (TEB) 8
Opportunities Fiscal stewardship. Long-run vs. short run tradeoffs. Reduce direct laboratory costs. Reduce indirect laboratory costs. Increase intellectual and emotional confidences of lab personnel, by indirectly contributing to their career success, and indirectly managing the quality and quantity of their hours worked in-the-lab and at home. Simple, easy-to-conceptually-understand example. 9
Quick Review of Bayesian Estimation Strategy and Some Collaborator-Friendly Notation Probability Based Decisions About Parameters and Future Events Prior p( ) x Likelihood L( |y) Posterior p( |y) Step 1: Start with our prior knowledge about the parameter represented as a prior distribution p( ). Step 2: Obtain additional information about the parameter from the data y collected following a specified probability model p(y| ). Condition on that data y to construct the likelihood function L( |y). Step 3: Update information on the parameter in the prior distribution p( ) in a weighted fashion multiplying p( ) by the likelihood function L( |y) to construct the posterior distribution p( |y) for the parameter . Step 4: Compute probabilities of future events y* by constructing the posterior predictive distribution p(y*|y) from the posterior distribution p( |y). More specifically for our problem, Calculate p( 0.80 | y) starting 30 Rhesus. Calculate p(y* 24 | y) starting 30 Rhesus. Identify N.pp = {N.50 , N.80 , N.90 , N.95} such that p(y* 24 | y) {.50, .80, .90, .95}. Predictive p(y*|y) 10
Sequential Bayesian Estimation p( ), L( |y), p( |y) 11
Sequential Bayesian Estimation Prediction p(y*|y) 12
Sequential Bayesian Estimation p( ), L( |y), p( |y) 13
Sequential Bayesian Estimation Prediction p(y*|y) 14
Sequential Bayesian Estimation p( ), L( |y), p( |y) 15
Sequential Bayesian Estimation Prediction p(y*|y) 16
Two Subsequent Questions So How many animals should we start in the Run-In period to get 24 to qualify for continuation into the randomized Treatment Period? And how sure are we of success? 19
Predictive Distributions p(y*|y) for 150 mg/dL Run-In Target 25
Summary of Bayesian Sequential Estimation Observed Rhesus TGs 150 mg/dL Cum Total Rhesus TGs 150 mg/dL .95 Credible Interval Prior Posterior Distribution Posterior Mean Study Distribution N 1 20 9/20 (.45) 9/20 .46 Beta (1,1) Beta (10,12) (.25, .66) 2 Beta (10,12) 9 2/9 (.22) .39 11/29 Beta (12,19) (.22, .57) 3 .43 Beta (12,19) 30 14/30 (.47) 25/59 Beta (26,35) (.30, .56) Prob 24+ Rhesus with TGs 150 mg/dL Pr(y* 24) Predicted Mean * Number Rhesus TGs 150 .95 Prediction Interval Following each study: Future N 12.8 ( 7, 19) 30 <.01 1. Pr( .80 | y) < .01 23.9 (14, 33) 56 .52 28.6 (18, 40) 67 .80 2. Pr(y* 24 | y) < .01 31.5 (20, 44) 74 .90 34.5 (22, 48) 81 .95 26
How to handle data from 3 studies simultaneously? Orientation of collaborators to hierarchical models Conceptual awareness (no, shrinkage did not come up yet) Subset of results Observed ml 9/20 (.45) 2/9 (.22) 14/30 (.47) Posterior Mean .43 .38 .44 .42 Prediction* Mean* Posterior Pr( i .80) < .01 < .01 < .01 < .01 .95 Cred Int (.27, .60) (.14, .57) (.29, .60) (.23, .60) Study 1 2 3 Overall Param 1 2 3 Probs* .95 Int* (.10, .72) (3, 23) .42 12.5 Pr( * .80) <.01 Pr(y* 24) < .01 * y* 27
Key Observations and Outcomes Importantly Posterior Probability p( 0.80 | {n1=20, y1=9, n2=9, y2=2, n3=30, y3=14}) < .01 Predicted Probability of Success (PPoS) p(y* 24 | {n1=20, y1=9, n2=9, y2=2, n3=30, y3=14}) < .01 Sample Size Recommendations p(y* 24 | n = {56, 67, 74, 81} = {.52, .80, .90, .95}) MORE Importantly Prior informed opinion ( = 0.80), other data analyses ( p<.05 ), , were naively used to arrive at faulty expectations. Collaborators quite surprised (ALARMED) at how small PPoS was. Opportunity to further evolve the fructose-induced hyperlipidemia Rhesus model. 28
Key Observations and Outcomes Further Evolve the Fructose-Induced Hyperlipidemia Rhesus Model Initial Discussions Enrich the Rhesus population. Boost fat content in the food. Boost caloric intake. Select on Framingham risk factors. Select on other biological covariates. Screen sooner and more frequently. Consider elevated endogenous TGs levels. Drive Rhesus to target TGs in just 30 days. Consider target TGs other than 150 mg/dL. TGs 125 mg/dL. 75 mg/dL, 50 mg/dL. Other Run-In Period data (placebo or otherwise) available? 29
Key Observations and Outcomes MOST Importantly Currently implementing full / partial Bayesian and much improved Frequentist designs, analyses, and decision rule strategies with many collaborators. Multiplicity. Adaptive designs. Skewed, truncated, mixtures of populations. Emphasis on understanding variability. Planning and decision-making through simulation. Protect research from Unnecessary risk Poor scientific integrity Avoidable delays Wasteful resource allocation Promote the ethical use of animals. Improve contract negotiations. 30
Key Observations and Outcomes Case Study in 4P Strategy of Collaboration Patience Naive Exposure Disbelief Champion Persistence Iterative process with peaks and valleys, but with more gains than losses. Positioning Mentor so that they see what you see, and it becomes their idea. Privilege Discovery scientists generally are a bright, energetic bunch who are intellectually and emotionally driven to discover. It is a privilege to be included in their quest. If you are successful, you will be rewarded with an if and only if ( ) professional, and often personal, working relationship. Do NOT simply provide statistical information to your collaborators, invite them to ride along together. Bayesian strategy aligns most often with decisions that discovery scientists want to make, and most often with what they really want to say. (TEB) Digestion Acceptance Supporter 31
References Ball, Michael (2009). The Three Rs and the Humanity Criterion, Nottingham, UK: FRAME. Russell, W.M.S. and R. L. Burch (1959). The Principles of Humane Experimental Technique, London, UK: Methuen. 32
Thank you ! 33


, L(π|y), p(π|y)")
")

 for N = 30")
 for N.50 = 56")
 for N.80 = 67")
 for N.90 = 74")
 for N.95 = 81")
 for")