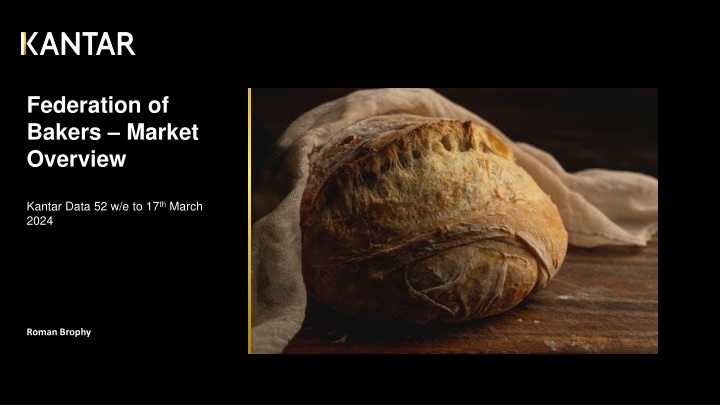
Federation of Bakers Market Overview: Strong Growth Trends
The market overview by Kantar data reveals that spend on bread and morning goods has seen double-digit growth over the past two years. Specialty bread stands out as a top performer. Both pre-packed and in-store bakery segments have experienced growth, with ISB driving volume growth despite price increases. Explore the detailed insights and trends in the bread sector.
Download Presentation

Please find below an Image/Link to download the presentation.
The content on the website is provided AS IS for your information and personal use only. It may not be sold, licensed, or shared on other websites without obtaining consent from the author.If you encounter any issues during the download, it is possible that the publisher has removed the file from their server.
You are allowed to download the files provided on this website for personal or commercial use, subject to the condition that they are used lawfully. All files are the property of their respective owners.
The content on the website is provided AS IS for your information and personal use only. It may not be sold, licensed, or shared on other websites without obtaining consent from the author.
E N D
Presentation Transcript
Federation of Bakers Market Overview Kantar Data 52 w/e to 17thMarch 2024 Roman Brophy
Spend on Bread and Morning Goods has experienced strong double-digit growth over the last two years. Despite this Volume has remained relatively stable highlighting the impacts of inflationary pressures within category Bread & Morning Goods Total Spend ( 000) and Packs (000) Spend ( 000) Volume (Packs 000) +10.5% 6000000 6000000 +12.8% +1.1% -1.3% 5000000 5000000 4000000 4000000 Volume (Packs 000) Spend ( 000) 3000000 3000000 2000000 2000000 1000000 1000000 0 0 52 w/e 20 Mar 22 52 w/e 19 Mar 23 52 w/e 17 Mar 24 52 w/e 20 Mar 22 52 w/e 19 Mar 23 52 w/e 17 Mar 24 2 2 Source: Kantar Worldpanel | Total Bread and Morning Goods | 52 w/e 17th March 24, 19th March 23 and 20th March 22
All Bread sectors experience strong Spend growth, however Specialty Bread is the standout performer due it seeing the highest Volume growth (+4.3%) and Spend growth (+14.1%) Bread & Morning Goods Total Spend ( 000) and Packs (000) by Segment 2.2bn +8% Traditional Ambient Bread -0.7% 1.7bn 1.4bn +13.9% Morning & Snack Bakery +2.6% 1.2bn +14.1% 1bn Speciality Bread Spend ( 000) Volume (Packs 000) +4.3% 860mn 1bn +8% -0.2% Traditional Rolls 980mn 3 3 Source: Kantar Worldpanel | Total Bread and Morning Goods | 52 w/e 17th March 2024
Both Pre-packed and ISB experience double-digit growth over the last two years, although ISB appears to be driving Volume growth. This could be driven by the slower increase in the Price per Pack (+8.9% vs +9.8%) Bread & Morning Goods Pre-Pack vs In Store Bakery (ISB) Spend ( 000) Volume (Packs 000) 52 w/e 20 Mar 22 52 w/e 19 Mar 23 52 w/e 17 Mar 24 52 w/e 20 Mar 22 52 w/e 19 Mar 23 52 w/e 17 Mar 24 +10.1% +0.6% -0.8% +12.8% 3.8bn 964mn 930mn 961mn 3.8bn 4.6bn 3.7bn 3.8bn 4.2bn 3.8bn -3.5% +12.6% 3.3% +13.1% 934mn 961mn 829mn 930mn 964mn 733mn Pre-packed ISB ISB Pre-packed 4 4 Source: Kantar Worldpanel | Total Bread and Morning Goods | 52 w/e 17th March 24 and 19th March 23 & 20th March 22
Both Pre-Packed and ISB experience growth over the last two years, although ISB is the driver of Volume growth. This is despite ISBs Price Per Pack increasing at a faster rate both YoY and 2YoY, +5 and +11 ppts, respectively. Traditional Ambient Bread | Pre-Pack vs In Store Bakery (ISB) Value (Spend) Volume (Packs) 52 w/e 20 Mar 22 52 w/e 19 Mar 23 52 w/e 17 Mar 24 52 w/e 20 Mar 22 52 w/e 19 Mar 23 52 w/e 17 Mar 24 -3.3% -1.4% +6.1% +11.5% 1.5bn 1.5bn 1.5bn 1.5bn 1.7bn 1.8bn +17.4% +21.6% +4.1% +1.8% 397m 219m 232m 338m 278m 223m Pre-packed ISB ISB Pre-packed 5 5 Source: Kantar Worldpanel | Traditional Ambient Bread | 52 w/e 17th March 24 and 19th March 23 & 20th March 22
ISB is gaining Spend Share in all Bread sectors other than Morning & Snack Bakery and Speciality Bread Pre-Packed ISB Bread & Morning Goods % Spend Share by Pre-Pack / ISB by Sector Traditional Ambient Bread Morning & Snack Bakery Speciality Bread Traditional Rolls Total Bread & Morning Goods 83.3 : 16.7 81.8 : 18.2 87.8 : 12.2 90.6 : 9.4 72.9 : 27.1 -0.4 -0.5 +0.2 +0.3 +1.4 ISB Percentage Point Share Change 6 6 Source: Kantar Worldpanel | Total Bread and Morning Goods Segemnts | 52 w/e 17th March 24
Over the last two years the average Private Label Price per Pack has been 23p lower compared to its Branded competitors. Resulting in Private Label continuously increasing their Spend and Volume (Pack) Share. Traditional Ambient Bread | Pre-Pack | Spend & Volume by Branded & Private Label Value Share (%) Volume (Pack) Share (%) 50.7 53.8 55.7 55.9 58.9 60.3 49.3 46.2 44.3 44.1 41.1 39.7 52 w/e 20 Mar 22 52 w/e 19 Mar 23 52 w/e 17 Mar 24 52 w/e 20 Mar 22 52 w/e 19 Mar 23 52 w/e 17 Mar 24 Branded Private Label Branded Private Label 7 7 Source: Kantar Worldpanel | Traditional Ambient Bread | Branded vs Private Label | 52 w/e 17th March 24, 19th March 23 and 20th March 22
Despite inflationary pressures causing both Branded and Private Label Pre-packed price increases, the gap between the two remains relatively flat between 0.21p and 0.25p Traditional Ambient Bread | Pre-Pack | Branded & Private Label Price Per Pack Average Price per Pack ( ) 1.6 1.4 1.4 1.28 1.16 1.12 1.2 1.04 0.91 1 0.8 0.6 0.4 0.2 0 M A M J J A S O O N D J F M A M J J A S O O N D J F M 24 23 Branded Private Label 8 8 Source: Kantar Worldpanel | Traditional Ambient Bread | Average Price Per Pack | Rolling 52 w/e 17th March 24
Within the Ambient Bread segment White bread is the only type increasing its Spend Share as it continues to attract more Shoppers. Brown and Grained are both more expensive per pack, which may have an impact on their Shares Ambient Bread % Spend and Shopper Change Spend Share of Traditional Ambient Bread Change in Shoppers vs 2 YA 2.6 3 3.4 7 7.6 9 Grained 13.8 13.9 14 7.2 8.4 Brown 9.2 Wholemeal 66.6 64.8 62.3 Half+Half White -2500000 -2000000 -1500000 -1000000 -500000 0 500000 1000000 52 w/e 20 Mar 22 52 w/e 19 Mar 23 52 w/e 17 Mar 24 White Half+Half Wholemeal Brown Grained 9 9 Source: Kantar Worldpanel | Traditional Ambient Bread | 52 w/e 17th March 24, 19th March 2023 and 20th March 2022
The Sub Roll category is the clear stand out performer within Total Bread & Morning Goods with strong double-digit growth Bread & Morning Goods - %Spend Growth & Shopper Change vs LY Top 5 Categories 1 2 The strong double-digit Sub Roll growth has been derived from Frequency growth (+11.4%) and the increased Price per Pack (+24.3%). As consumers continue to make simpler meal choices and see value in the volume promotions the Total Bread & Morning Goods market will continue to benefit from increased Spend. 1 2 Aldi and M&S have been stand out performers within the Sub Roll category as they have experienced +88.1% and +26.2% Spend growth, respectively. 10 10 Source: Kantar Worldpanel | Total Bread and Morning Goods | 52 w/e 17th March 43 vs LY
Private Label holds over 50% Spend Share in Total Bread & Morning Goods and all Bread segments apart from Traditional Ambient Bread Bread & Morning Goods - % Branded / Private Label Spend by Sector Spend Share (%) Bread & Morning Goods Sector 47.6 59.5 59.8 66.5 74.2 52.4 40.5 40.2 33.5 25.8 Total Bread & Morning Goods Traditional Ambient Bread Morning+Snack Bakery Speciality Bread Traditional Rolls Branded Private Label 11 11 Source: Kantar Worldpanel | Total Bread and Morning Goods Segments| 52 w/e 17th March 24
A similar picture is evident when looking at Volume (Pack) Share as Private Label holds over 50% share across Total Bread & Morning Goods and all its Bread segments Bread & Morning Goods - % Branded / Private Label Volume (Packs) by Sector Volume (Pack) Share (%) Bread and Morning Goods Sectors 52.7 66.4 68 75.6 77 47.3 33.6 32 24.4 23 Total Bread & Morning Goods Traditional Ambient Bread Morning+Snack Bakery Speciality Bread Traditional Rolls Branded Private Label Chart Footnote 12 12 Source: Kantar Worldpanel | Total Bread and Morning Goods Segments | 52 w/e 17th March 24
Pre-packed is more varied in terms of Bread types, whereas ISB is dominated by White bread (88% Share) Ambient Bread % Volume by Bread Type ISB Volume (Pack) Percentage Share Pre-Pack Volume (Pack) Percentage 2.9 2.5 2.2 5.2 6 7 4.9 5.3 5.5 19.5 19.1 18.8 5 5.2 8.9 10.4 6.8 11.9 2.1 2.3 2.7 62.5 60.7 58.3 88 87.2 85 52 w/e 20 Mar 22 52 w/e 19 Mar 23 52 w/e 17 Mar 24 52 w/e 20 Mar 22 52 w/e 19 Mar 23 52 w/e 17 Mar 24 White Half+Half Wholemeal Brown Grained All Others White Half+Half Wholemeal Brown Grained All Others 13 Source: Kantar Worldpanel | Total Bread and Morning Goods | Pre-Pack and ISB Volume (Pack) Share (%) | 52 w/e 17th March 24, 19th March 2023 and 20th March 2022 13
Since Covid restrictions eased Penetration growth began to slow and even began contributing to decline during Oct 22 Sep 23. However, Penetration has since improved, most recently contributing + 1.5m this period Total Bread and Morning Goods | Sourdough Bread | Rolling 12 w/e Measure Tree | 12 w/e 17th March 2024 Rolling 12we Measure Tree 5,000 Covid 4,000 3,000 Contribution 2,000 1,000 0 -1,000 -2,000 J J A S O N N D J F M A M J J A S O O N D J F M A M J J A S O O N D J F M A M J J A S O O N D J F M 21 22 23 24 GB HH Population Penetration (%) Price per Pack Trip Packs Frequency Total Contribution ( 000s) 14 14 Source: Kantar Worldpanel | Total Bread and Morning Goods | Sourdough Bread | Rolling 12 w/e 17th March 2024
Private Label expands its Sourdough Spend Share by +1.8 ppts Total Bread and Morning Goods | Sourdough Bread | Branded vs Private Label Spend Share (%) | 12 w/e 17th March 2024 vs LY Branded Private Label Spend Share: 37.2% Spend Share: 62.8% -1.8 ppts +1.8 ppts 15 15 Source: Kantar Worldpanel | Total Bread and Morning Goods | Sourdough Bread | Branded vs Private Label Spend Share (%) | 52 w/e 17th March 2024 vs LY
Tesco continue to hold the largest Spend Share despite the Traditional Big Four all experiencing Spend Share declines YoY Total Bread and Morning Goods | Retailer Spend Share (%) | 52 w/e 17th March 2024, 19th March 2023 and 20th March 2022 Spend Share (%) Bread Retailers 4.9 5.1 5.8 5.4 6.7 7.5 8.2 9.6 10.2 4.7 4.4 4.3 8.1 8.1 7.8 9.1 8.3 7.8 13.4 13.2 12.7 11.7 11.6 11.2 24.5 23.7 23.4 In-Store Bakery: 17.6% 52 w/e 20 Mar 22 52 w/e 19 Mar 23 52 w/e 17 Mar 24 Total Tesco Total Asda Total Sainsbury's Total Morrisons The Co-Operative Total Iceland Total Waitrose Ocado Internet Aldi Lidl Total Marks & Spencer 16 Source: Kantar Worldpanel | Total Bread and Morning Goods | Retailer Spend Share (%) | 52 w/e 17th March 2024, 19th March 2023 and 20th March 2022
1 7 Thank you Roman Brophy Roman.Brophy@kantar.com Kantar | Westgate | London | W5 1UA | www.kantar.com
