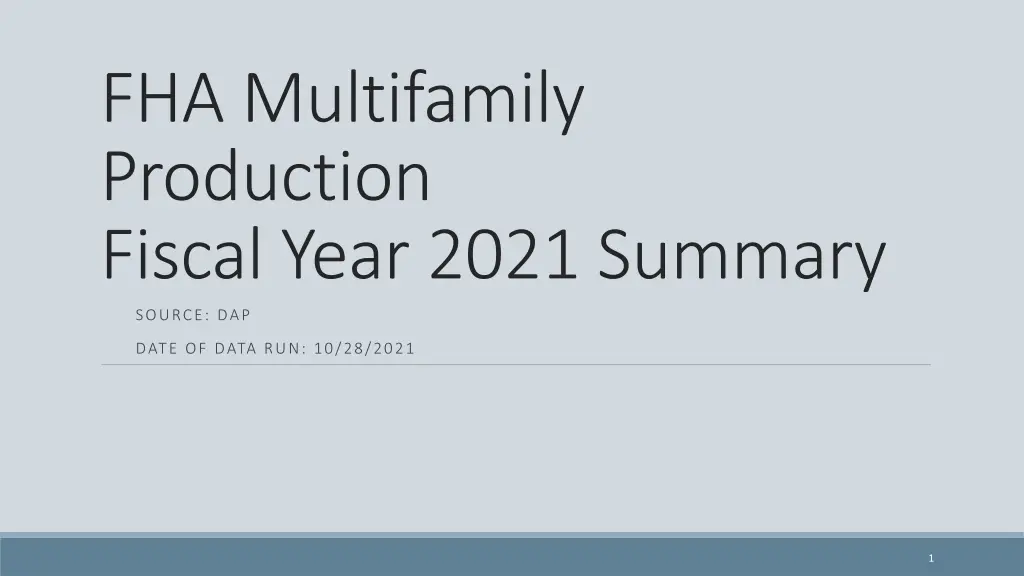
FHA Multifamily Production Fiscal Year 2021 Summary
Explore the detailed comparison between FHA Multifamily Production in fiscal year 2020 and 2021, highlighting changes in endorsements, mortgage amounts, units, and more. The report includes data on total firms issued, firm commitments by lenders, and more insights into the multifamily housing sector.
Download Presentation

Please find below an Image/Link to download the presentation.
The content on the website is provided AS IS for your information and personal use only. It may not be sold, licensed, or shared on other websites without obtaining consent from the author. If you encounter any issues during the download, it is possible that the publisher has removed the file from their server.
You are allowed to download the files provided on this website for personal or commercial use, subject to the condition that they are used lawfully. All files are the property of their respective owners.
The content on the website is provided AS IS for your information and personal use only. It may not be sold, licensed, or shared on other websites without obtaining consent from the author.
E N D
Presentation Transcript
FHA Multifamily Production Fiscal Year 2021 Summary SOURCE: DAP DATE OF DATA RUN: 10/28/2021 1
FHA Multifamily Production Fiscal Year 2020 vs Fiscal Year 2021 FY20 Initial Endorsements FY21 Initial Endorsements Change in Volume by SOA FY20 vs FY21 Total Mortgage Amount at Initial Endorsement $3,777,000,100 $8,868,617,600 Total Number of Projects Total Mortgage Amount at Initial Endorsement $7,738,137,840 $15,310,137,100 Total Number of Projects % Change ($$) 104.9% SOA Category 223a7 Refi Apts 223f Refi/Purchase Apts 241a Impvmts Apts FHA NC/SR Apts HFA Risk Sharing QPE Risk Sharing Grand Total Total Units 37,967 75,610 SOA Category 223a7 Refi Apts 223f Refi/Purchase Apts 241a Impvmts Apts FHA NC/SR Apts HFA Risk Sharing QPE Risk Sharing Grand Total Total Units 77,661 127,398 SOA Category 223a7 Refi Apts 223f Refi/Purchase Apts 241a Impvmts Apts FHA NC/SR Apts HFA Risk Sharing QPE Risk Sharing Grand Total 224 485 464 807 72.6% -34.8% -0.7% 18.5% -100.0% 55.0% $54,213,500 $5,314,932,800 $941,957,207 $61,900,000 $19,018,621,207 5 664 $35,359,900 $5,276,709,500 $1,116,655,495 6 1,078 35,302 10,037 207 74 36,797 8,906 454 160,398 217 84 2 $0 0 0 997 $29,476,999,835 1,578 251,476 Total Risk Share Total Risk Share Total Risk Share $1,003,857,207 76 9,360 $1,116,655,495 84 10,037 11.2% With LIHTC (excluding risk share) Without LIHTC (excluding risk share) Grand Total (excluding risk share) With LIHTC (excluding risk share) Without LIHTC (excluding risk share) With LIHTC (excluding risk share) Without LIHTC (excluding risk share) $2,794,675,100 196 29,805 $4,113,340,740 291 41,447 47.2% $15,220,088,900 725 121,233 $24,247,003,600 1,203 199,992 59.3% $18,014,764,000 921 151,038 Grand Total $28,360,344,340 1,494 241,439 Grand Total 57.4% 2
TOTAL FIRMS ISSUED ($$) $3,319,602,747 $3,021,563,196 $2,638,256,900 $2,305,867,524 $2,114,566,800 $1,651,824,688 $1,277,113,600 $913,726,400 $905,243,100 $886,293,900 $858,632,300 $783,596,900 $761,959,500 $744,297,300 $650,373,900 $614,899,200 $502,497,500 $489,358,200 $426,071,530 $351,186,300 TOTAL FIRMS ISSUED (COUNT) MAP LENDER AT FIRM ISSUED 1 GREYSTONE FUNDING COMPANY LLC 2 DWIGHT CAPITAL LLC 3 BERKADIA COMMERCIAL MTG 4 WALKER AND DUNLOP LLC 5 ROCKPORT MORTGAGE 6 MERCHANTS CAPITAL CORP 7 ORIX REAL ESTATE CAPITAL LLC 8 MASON JOSEPH COMPANY INC 9 GERSHMAN INVESTMENT 10 JONES LANG LASALLE MULTIFAMILY, LLC 11 PRUDENTIAL HUNTOON PAIGE 12 WELLS FARGO BANK NA 13 AGM FINANCIAL SERVICES 14 COLLIERS MORTGAGE LLC 15 M & T REALTY CORP 16 KEYBANK NA 17 GRANDBRIDGE REAL ESTATE CAP 18 BELLWETHER REAL EST CAPITAL 19 ARBOR AGENCY LENDING, LLC 20 CBRE HMF INC 156 151 125 100 73 114 113 34 58 39 51 29 39 56 24 17 26 35 34 23 FY21 Firm Commitments by Lender (MAP Applications) 3
TOTAL IE (COUNT) MAP LENDER AT INITIAL ENDORSEMENT (IE) 1 ORIX REAL ESTATE CAPITAL LLC 2 GREYSTONE FUNDING COMPANY LLC 3 DWIGHT CAPITAL LLC 4 BERKADIA COMMERCIAL MTG 5 WALKER AND DUNLOP LLC 6 MERCHANTS CAPITAL CORP 7 GERSHMAN INVESTMENT 8 MASON JOSEPH COMPANY INC 9 COLLIERS MORTGAGE LLC 10 JONES LANG LASALLE MULTIFAMILY, LLC 11 PRUDENTIAL HUNTOON PAIGE 12 AGM FINANCIAL SERVICES 13 WELLS FARGO BANK NA 14 M & T REALTY CORP 15 BELLWETHER REAL EST CAPITAL 16 KEYBANK NA 17 GRANDBRIDGE REAL ESTATE CAP 18 NORTHMARQ FINANCE LLC 19 MASSACHUSETTS HFA 20 CBRE HMF INC TOTAL IE ($$) $3,413,295,600 $3,403,676,800 $3,000,806,900 $2,713,449,700 $2,172,599,900 $1,451,010,540 $943,259,000 $897,339,200 $715,024,500 $683,162,400 $680,524,300 $657,937,700 $583,798,900 $505,838,500 $494,161,600 $464,450,900 $463,882,500 $456,422,900 $439,317,500 $434,564,600 183 161 147 115 92 99 53 36 62 29 50 37 30 18 37 16 26 21 11 27 FY21 Initial Endorsements by Lender (MAP Applications) 4
Average Loan Size at Initial Endorsement FY19 FY21 $21,734,712 FHA NC/SR Apts $25,676,004 $24,316,634 $14,648,861 223f Refi/Purchase Apts $18,285,809 $18,971,669 $14,860,167 223a7 Refi Apts $16,861,608 $16,677,021 $0 $5,000,000 $10,000,000 $15,000,000 $20,000,000 $25,000,000 $30,000,000 FY19 FY20 FY21 5
Percentage Affordable Firms Issued by Count and Volume FY19-FY21 (all MF Production SOAs including risk share) 70% 62% 60% 50% 46% 45% 45% 40% 37% 34% 30% 20% 10% 0% FY19 FY20 FY21 % Affordable (Count) % Affordable ($$) *All projects that qualify for an Affordable or Broadly Affordable MIP rate based on the March 2016 Federal Register notice announcing changes to MIP rates are considered affordable for the purpose of this analysis. 6


