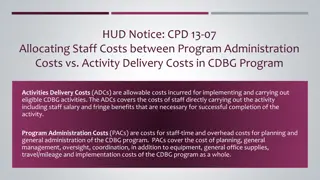
Final Recommendations on Administrative Expenses Analysis
Dive into the final recommendations on administrative expenses provided by Amanda Brown and Justin Silverstein in this insightful presentation. Explore in-depth analysis, reviews, and insights into administrative expenditures, all aimed at enhancing your understanding and decision-making processes.

Download Presentation

Please find below an Image/Link to download the presentation.
The content on the website is provided AS IS for your information and personal use only. It may not be sold, licensed, or shared on other websites without obtaining consent from the author. If you encounter any issues during the download, it is possible that the publisher has removed the file from their server.
You are allowed to download the files provided on this website for personal or commercial use, subject to the condition that they are used lawfully. All files are the property of their respective owners.
The content on the website is provided AS IS for your information and personal use only. It may not be sold, licensed, or shared on other websites without obtaining consent from the author.
E N D
Presentation Transcript
Final Recommendations on Administrative Expenses Amanda Brown and Justin Silverstein, APA
Presentation Overview Recommendations based upon Definition of expenses (previous presentations) Review of relevant expenditure functions and current data collection Additional expenditure analysis in five districts Review of current Nevada district expenditures FY18-FY20 2
Additional Analysis for this Presentation Request by Commission to further review district expenses Reviewed three years of actual/budgeted expenditures by district (FY18-20) Spoke with five districts about their administrative expenses and appropriate accounting codes to use Calculated administrative expenses both as a per student figure and as percentage by dividing expenditures by size- adjusted base for each district Used highest figures of three years of budget information 3
Defining Administrative Expenses As discussed in prior presentations: Few states set limits on administrative expenses, so there is not a commonly accepted definition NCES data is inconsistent Not specifically defined in the bill and no record of legislative intent available Received feedback that the intent was to limit administrative salaries and not a measure of all centrally-managed functions and expenses (such as maintenance and operations, transportation, etc.) Working with NDE and Commission, focused analysis on administrative personnel expenditures 4
Current Reporting of Administrative Expenses Current reporting sources: District budgets submitted to the state NDE s Statewide Report of School Finances (NRS 385.303) Used as the source for prior administrative expense discussions Both use NDE s Chart of Accounts with specific definitions for accounting function and object codes Aligned with federal fiscal data reporting requirements Differ in the level of disaggregation 5
How Does Each Source Report Administrative Expenses? District budgets submitted to the state Reports General Administration (2300), School Administration (2400) and Central Services (2500) separately NDE s Statewide Report of School Finances (NRS 385.303) Reports Administration Support as 2300 (General Administration) and 2400 (School Administration) collectively Reports Central Services (2500) as part of Other Support in conjunction with 2600 (Operations and Maintenance), 2700 (Student Transportation), and 2900 (Other Support Services) Both disaggregate by salaries (100), benefits (200), purchased services (300/400/500), supplies (600), property (700) and misc. (800) NDE s report separately shows each purchased service category, but across all functions District budgets separate by function, but group purchased services (300/400/500) 6
Administrative Function Codes and Definitions: 2300 Support Services Board Treasurer Services Election Services Tax Assessment and Collection Services Staff Relations and Negotiations Other Board of Education Services Legal Services Other Support Services Executive Administration Office of the Superintendent Community Relations State and Federal Relations Other Executive Administration 2300 Support Services- General Administration Activities concerned with establishing and administering policy for operating the school district. Includes: Board of Education Supervision of Board of Education Services Board Secretary/Clerk Services 7
Administrative Function Codes and Definitions: 2400 Support Services 2400 Support Services- School Administration Activities concerned with overall administrative responsibility for a school. Includes: Office of the Principal Other Support Services-School Administration Other school administration services. This function includes graduation expenses and full-time department chairpersons. 8
Administrative Function Codes and Definitions: 2500 Central Services Purchasing, Warehousing, and Distributing Services Printing, Publishing, and Duplicating Services Planning, Research, Development, and Evaluation Services Public Information Services Personnel Services Administrative Technology Services Other Support Services-Central Services 2500 Central Services Activities that support other administrative and instructional functions including fiscal services, human resources, planning, and administrative information technology. Includes: Fiscal Services 9
Administrative Object Codes and Definitions Within each function, expenditures are disaggregated by the following object codes: 100- Salaries 200- Benefits 300- Professional and Technical Services 400- Purchased Property Services 500- Other Purchased Services 600- Supplies 700- Property 800- Other 10
Detail on Purchased Services (300/400/500) 300- Professional and Technical Services Official/Administrative Services Professional Educational Services Employee Training and Development Services Other Professional Services Technical Services 400- Purchased Property Services Utility Services Cleaning Services Repairs and Maintenance Services Rentals Construction Services Other Purchased Property Services 500- Other Purchased Services Student Transportation Services Insurance (Other Than Employee Benefits) Communications Advertising Printing and Binding Tuition Food Service Management Travel Inter-educational, Interagency Purchased Services 11
Which Areas of Purchased Services to Include As noted previously, APA's focus is on identifying personnel costs at the central office In reviewing purchased services it seemed clear that Purchased Property Services (400) and Other Purchased Services (500) were not as relevant APA then took a closer look at Professional and Technical Services (300) 12
Further Detail on Professional and Technical Services (300) Based upon a review of five district s purchased service expenditures, we found variation in what this category included, such as: Staff training expenses like conference fees Audit services HR services such as background checks/fingerprinting IT support contracts Software licenses Including licenses used by schools, such as Infinite Campus, and assessment licenses Membership fees Legal services 13
Professional and Technical Services (300), continued Within these uses, there were some expenses for staff that could otherwise be in-house (and therefore would have been captured in salaries and benefits in another district): Examples: grant writers, attorneys, IT personnel, business service staff However, it is not reported to the state at the level of detail to parse personnel expenses within the 300 category At this time, we recommend continuing to focus on salaries and benefits only 14
Recommendation 1: Define Administrative Expenses as General Administration (2300) + Central Services (2500) 15
Recommendation 1 In prior presentation, discussed administrative expenses as reported in the NDE Statewide Report Included School Administration Further discussions with districts prompted APA to revise administrative expense definition to focus on central administration functions Exclude School Administration (2400) Include Central Services (2500) Accounting, HR, Legal, IT, etc. 16
Recommendation 2: Within General Administration (2300) + Central Services (2500), narrow definition of Administrative Expenses to salaries (100) and benefits (200) 17
Recommendation 2 In prior presentation, focused on salaries (100) and benefits (200), question arose of whether purchased services (300/400/500) should be included? Discussed with several district administrators/budget officials, and requested additional budget detail on the expenditures within the purchased service category Determined that Purchased Property Services (400) and Other Purchased Services (500) should be excluded, but there may be certain items within Professional and Technical Services (300) that are relevant However, what expenses are coded within this category are inconsistent and year-to-year amounts vary significantly, so the focus on the initial calculation of administrative expenses should be on salaries (100) and benefits (200) only 18
Recommendation 3: Set Tiered Administrative Cost Targets as a Percentage of Each District s Size-Adjusted Base 19
General Administration (2300) + Central Services (2500), Salaries and Benefits Only Three-year Highest Percentage (of Size Adjusted Base Cost) Three-year Highest Cost Per Student District Esmerelda Eureka Storey Mineral Pershing Lincoln Lander White Pine Churchill Humboldt Nye Douglas Carson Lyon Elko Washoe Clark Enrollment (FY20) 75 318 438 571 654 901 978 1,217 3,182 3,394 5,222 5,707 7,740 8,806 9,991 63,555 316,963 $5,001 $2,641 $1,250 $1,702 $1,333 $826 $826 $757 $724 $482 $697 $321 $422 $429 $315 $375 $197 25.4% 18.9% 9.7% 13.7% 11.5% 7.7% 7.7% 6.6% 8.9% 5.5% 7.8% 3.9% 5.5% 4.8% 3.5% 5.0% 2.7% 20
Chart: Three-year Highest Cost Per Student Three-year Highest Cost Per Student, Districts Less Than 10,000 students $6,000 $5,000 $4,000 $3,000 $2,000 $1,000 $0 0 1,000 2,000 3,000 4,000 5,000 6,000 7,000 8,000 9,000 10,000 Three-year Highest Cost Per Student 21
Chart: Three-year Highest Percentage of Size Adjusted Base Cost Three-year Highest Percentage of Size Adjusted Base Cost, Districts Less Than 10,000 30.0% 25.0% 20.0% 15.0% 10.0% 5.0% 0.0% 0 1,000 2,000 3,000 4,000 5,000 6,000 7,000 8,000 9,000 10,000 Three-year Highest Percentage (of Size Adjusted Base Cost) 22
Recommendation 3 Intention is to set targets at least a full percentage point higher than current as a cushion for districts One exception noted below Set tiered administrative expense limit targets: Over 100,000 students: 5 percent 7,500 students up to 100,000 students: 7.5 percent 1,000 students up to 7,500 students: 10 percent 500 students up to 1,000 students: 15 percent Less than 500 students: 25 percent (expected to be adjusted downward to 20 percent with consistency of coding changes) 23
Chart: Tiered Administrative Expense Percentages Three-year Highest Percentage of Size Adjusted Base Cost, Districts Less Than 10,000 30.0% 25% 25.0% 20.0% 15% 15.0% 10% 10.0% 7.5% (up to 100,000 students) 5.0% 0.0% 0 1,000 2,000 3,000 4,000 5,000 6,000 7,000 8,000 9,000 10,000 Three-year Highest Percentage (of Size Adjusted Base Cost) 24
Additional Recommendations Recommendation 4: NDE should work collaboratively with districts to ensure consistent expense coding Examples of relevant variation: Not all districts report costs within Central Services or School Administration Currently these costs are buckets under General Administration Expenditures that are in support of schools (and could be therefore attributed to the school level) are recorded in Central Services or General Administration There has been no reason/incentive to do so previously Recommendation 5: NDE should monitor district expenses over time and adjust initial administrative expense targets accordingly 25
Questions? 26


")


,")


 + Central Services (2500),")