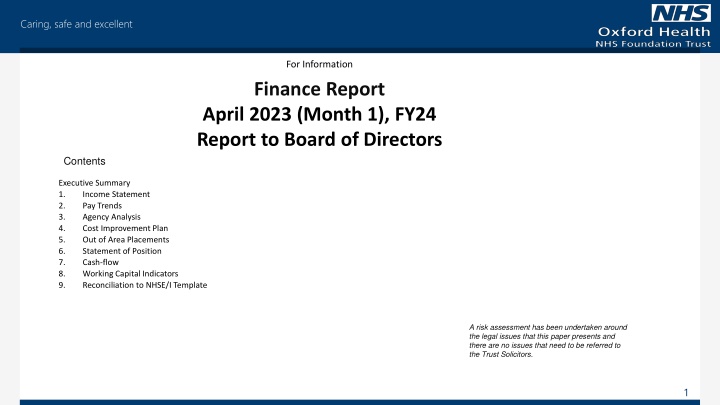
Finance Report
The Finance Report for April 2023 provides insights into income statements, pay trends, agency analysis, and more. The Executive Summary highlights deficits, planned surpluses, and key financial adjustments. Explore the financial performance and forecasts for the month, including details on income, expenses, and strategic changes to improve financial outcomes.

Download Presentation

Please find below an Image/Link to download the presentation.
The content on the website is provided AS IS for your information and personal use only. It may not be sold, licensed, or shared on other websites without obtaining consent from the author.If you encounter any issues during the download, it is possible that the publisher has removed the file from their server.
You are allowed to download the files provided on this website for personal or commercial use, subject to the condition that they are used lawfully. All files are the property of their respective owners.
The content on the website is provided AS IS for your information and personal use only. It may not be sold, licensed, or shared on other websites without obtaining consent from the author.
E N D
Presentation Transcript
Caring, safe and excellent For Information Finance Report April 2023 (Month 1), FY24 Report to Board of Directors Contents Executive Summary 1. Income Statement 2. Pay Trends 3. Agency Analysis 4. Cost Improvement Plan 5. Out of Area Placements 6. Statement of Position 7. Cash-flow 8. Working Capital Indicators 9. Reconciliation to NHSE/I Template A risk assessment has been undertaken around the legal issues that this paper presents and there are no issues that need to be referred to the Trust Solicitors. 1
Caring, safe and excellent Executive Summary Highlights: The month 1 position is a deficit of 0.1m, 0.2m adverse to plan. This includes 857k of one-off spend in April. Directorate positions are not shown in this report as not all budget adjustments have been completed. The plan figures reported in this report are based on a planned surplus of 226k. Since the month 1 position has been finalised the Trust s plan has been changed through agreement with the ICS to a surplus of 3.3m. This is due to additional income from the ICB and release of Provider Collaborative deferred income to fund appropriate projects. These changes will improve the plan and actual figures so do not affect the variance to plan. Excluding spend related to FY23, the FY24 spend on agency staff is 3.1m, which is 10.8% of total staff costs. Capital isn t reported this month as the Capital plan has not yet been agreed. 2
Caring, safe and excellent 1. Income Statement INCOME STATEMENT Month 1 Plan m 41.0 6.8 47.9 29.3 17.3 46.6 1.3 1.3 0.0 0.0 0.0 Actual m 40.3 Variance m (0.7) 1.1 0.4 (0.2) (0.4) (0.6) (0.2) 0.0 (0.2) 0.0 (0.2) Clinical Income Other Operating Income Operating Income, Total Employee Benefit Expenses (Pay) Other Operating Expenses Operating Expenses, Total EBITDA Financing costs Surplus/ (Deficit) Adjustments Adjusted Forecast Surplus/ (Deficit) 8.0 48.3 29.5 17.7 47.2 1.1 1.3 (0.2) 0.0 (0.1) Month 1 Performance The month 1 position is a deficit of 0.1m, 0.2m adverse to plan. This includes 857k of one-off spend in April - 440k for agreed non-recurrent spend in FY23 where goods were not received until April ( 180k of this was not accrued by Finance in error), 267k for items relating to prior years which were not known about at year- end as they were invoiced late and 150k one-off replacement of doors and windows at the Oxford Clinic. Directorate positions are not shown in this report as not all budget adjustments have been completed. The plan figures reported in this report are based on a planned surplus of 226k. Since the month 1 position has been finalised the Trust s plan has been changed through agreement with the ICS to a surplus of 3.3m. This is due to additional income from the ICB and release of Provider Collaborative deferred income to fund capital spend. These changes will improve both the plan and the actual figures so do not affect the variance to plan. The budget adjustments to reflect these changes will be done for month 2 reporting. 3
Caring, safe and excellent 2. Pay Trends The increase in pay costs and budget in September 2021 and September 2022 reflect when the pay award was paid to staff along with back pay. The increased costs in March 2022 reflect year-end accounting adjustments for pension costs The increase in costs in March 2023 again reflect year-end accounting adjustments for pension costs and also an accrual for the government proposed back-dated non-consolidated pay award. The increase in Bank WTE in March 2023 follows the transfer to NHS Professionals 4
Caring, safe and excellent The increase in budget in Forensics in October 2022 is due to budget which was transferred from Reserves this was growth funding received from NHS England and mainly covers existing cost pressures. 6
Caring, safe and excellent 3. Agency Analysis At month 1 3.2m has been spent on agency staff. Excluding spend related to FY23, the FY24 spend on agency staff is 3.1m, which is 10.8% of total staff costs. These figures and the graphs above now include agency spend related to Covid vaccinations from April, but the figures from previous years still exclude this spend. The accruals for March and April are based on actual hours worked but rates were not available on the data provided by NHSP. Average rates per type of shift and worker were used and actual costs could vary from this. Finance and Workforce are working on understanding any differences between their figures and ensuring consistent reporting going forward. The Trust s agency target set by NHS England for FY24 is 32m. A straight line forecast of the month 1 amount would give a forecast of 38.4m, 4.8m above the target. In a recent meeting with NHS England around the Trust s financial plans for FY24 the Trust s high agency spend and being an outlier in this area were raised as the main area of concern with the Trust s financial performance. It is expected that the transfer to NHS Professionals and other initiatives from the Improving Quality Reducing Agency (IQRA) will reduce agency costs in FY24. 8
Caring, safe and excellent 4. . Cost Improvement Programme (CIP) The CIP targets and plans identified during the planning are shown in the table below. Clinical directorates are addressing CIP targets during new resource planning, meaning CIP delivered on release of additional budget. The central CIP of 1m relates to savings made by the NHSP transfer which releases the temporary staffing team budget as a saving. 9
Caring, safe and excellent 5. Out of Area Placements (OAPs) Out of Area Placements are 74k overspent at month 1 15K adverse in Oxfordshire and 59k adverse in Buckinghamshire. This includes the cost of the 4 block beds contract with currently hold with Elysium. These costs exclude Secure Transport spend which is currently 34k across the two directorates. Costs are generally down in month 1 due to low admissions and multiple discharges across the two counties. 10
Caring, safe and excellent Oxon & Bucks OAPS Spend by bed type The above graphs show a sharp increase in month 1 of FY23. This is due to allocations of costs prior to FY23 being reclaimed from national COVID funding. Oxon s month 4 decrease was due to the release of an FY21 provision. The Sharp decrease in Bucks in month 8 was also due to a release of an old year provision. Month 1 FY24 decrease is due to low new admissions and multiple discharges across the counties with a slight rise in Bucks against Acute beds. At the end of April Oxfordshire have 5 Rehab & 1 Continuing Care patients still out & Buckinghamshire have 3 Acute, 1 PICU & 1 Rehab patient still out of area. 11
Caring, safe and excellent 6. Statement of Financial Position Statement of Financial Position as at 30th April 2023 Movement 31 March 2023 Month 12 Month 1 FY24 Year to date '000 In month FY23 1. Non-current assets have decreased by ( 1.0m) in-year. Most of the decrease can be attributed to the in-month depreciation charge of ( 1.1m), offset by additions of 0.1m. '000 '000 '000 '000 Non-current assets Intangible assets Property, plant and equipment Finance leases Investments Trade and other receivables Other assets Total non-current assets 4,977 188,517 27,294 1,125 4,977 188,517 27,294 1,125 4,930 188,044 26,805 1,125 (47) (474) (489) (47) (474) (489) 2. Inventories decreased by ( 0.5m) in year due a reduction in contingency stock. 0 7 0 0 7 0 3. Trade and other receivables decreased by ( 8.5m) in month. This is largely due to a decrease in outstanding debt of ( 8.0m). 512 268 512 268 519 268 4. The cash balance has increased by 11.5m over the year. This was largely driven by the decrease in receivables of 8.5m and an increase in deferred income of 2.9m 222,693 222,693 221,691 (1,002) (1,002) Current Assets Inventories Trade and other receivables Cash and cash equivalents Total current assets 2,932 35,215 74,826 112,973 2,932 35,215 74,826 112,973 2,449 26,722 86,380 115,552 (483) (8,493) 11,554 2,578 (483) (8,493) 11,554 2,578 5. Trade and other payables have decreased by 0.9m in year. 6. Deferred income has increased by ( 2.9m) in month. Current Liabilities Trade and other payables Borrowings Finance Leases Provisions Deferred income Total Current Liabilities 7. The Trust s long term finance lease liabilities have decreased by 0.2m in-month as a result of in-month capital repayments (83,398) (2,019) (5,374) (2,249) (23,002) (116,042) (83,398) (2,019) (5,374) (2,249) (23,002) (116,042) (82,498) (2,068) (5,370) (2,249) (25,878) (118,063) 900 (49) 900 (49) 4 0 (2,876) (2,021) 4 0 8. The in-month movements in the I&E reserve reflects the Trust s reported deficit for the month ( 0.2m). (2,876) (2,021) Non-current Liabilities Borrowings Finance Leases Provisions Total non-current liabilities Total assets employed (14,641) (19,981) (6,085) (40,707) 178,918 (14,641) (19,981) (6,085) (40,707) 178,918 (14,585) (19,762) (6,069) (40,416) 178,765 56 219 16 291 (153) 56 219 16 291 (153) Financed by (taxpayers' equity) Public Dividend Capital Revaluation reserve Other reserves Income & expenditure reserve 109,631 54,359 1,125 13,803 109,631 54,359 1,125 13,803 109,631 54,360 1,125 13,649 0 1 0 0 1 0 (154) (154) 178,918 Total taxpayers' equity 178,918 178,766 (153) (153) 12
Caring, safe and excellent 7. Cash Flow STATEMENT OF YEAR TO DATE CASH FLOWS Summary Notes Month 1 FY24 Actual '000 Plan Variance '000 The cash flow movements are consistent with the comments made on the Statement of Financial Position. '000 Cash flows from operating activities Operating surplus/(deficit) from continuing operations Operating surplus/(deficit) (13) (13) 72 72 (86) (86) The closing cash position at the end of April was 86.4m. Non-cash income and expense: Depreciation and amortisation (Increase)/Decrease in Trade and Other Receivables (Increase)/Decrease in Inventories Increase/(Decrease) in Trade and Other Payables Increase/(Decrease) in Deferred Income Increase/(Decrease) in Provisions NET CASH GENERATED FROM/(USED IN) OPERATIONS 1,133 8,493 483 (528) 2,876 (18) 12,426 1,195 5,228 350 3,519 1,950 (62) 3,265 133 (4,047) 926 (57) 39 12,353 73 Cash flows from investing activities Interest received Purchase of Non Current Assets Net cash generated from/(used in) investing activities 331 (959) (628) 326 5 (1,408) (1,082) 449 453 Cash flows from financing activities Public dividend Capital Received Capital element of lease rental payments Capital element of Private Finance Initiative Obligations Interest paid Interest element on leases Interest element of Private Finance Initiative obligations PDC Dividend paid Net cash generated from/(used in) financing activities 0 0 0 (224) (411) 187 0 0 0 0 0 0 1 0 0 (20) (21) 0 0 0 0 (244) (432) 188 11,554 74,827 86,381 10,840 74,827 85,667 714 Increase/(decrease) in cash and cash equivalents Cash and Cash equivalents at 1st April Cash and Cash equivalents at 30th April 0 714 13
Caring, safe and excellent 8. Working Capital Indicators Working Capital Ratios Ratio Target Actual Risk Status Debtor Days 30 41 Debtors % > 90 days 5.0% 18.8% Creditor Days 30 51 BPPC NHS - Value of Inv's pd within target (ytd) 95.0% 88.5% BPPC Non-NHS - Value of Inv's pd within target (ytd) 95.0% 95.5% Cash ( m) 85.7 86.4 Summary Notes Debtor days are worse than plan. Debtors % over 90 days is worse than plan, due to unpaid invoices from mostly NHS debtors BOB ICB 463k (of which 394k was paid in M2) and NHS Property Services 154k. Creditor days is worse than plan due to high accrual levels and NHS BPPC figures below target. NHS BPPC (Better Payments Practice Code) is below target in-month. Non-NHS BPPC (Better Payments Practice Code) is ahead of target. Cash is better than plan, as outlined in section 9. 14
Caring, safe and excellent 9. Reconciliation to NHSE Template The reconciliation to the NHSE template has been included previously as the financial figures reported to NHSE each month excluded income and costs related to the Section 75 pooled budgets. Revised section 75 agreements are in place now and these are no longer required to be excluded from the Trust s accounts. There will still be some minor category adjustments due to the requirements of the NHSE template but these are not material. Therefore this reconciliation is no longer required. 15