Finance Report
This finance report for October 2023 provides a comprehensive overview of the company's financial status, including an income statement and forecast movements compared to the previous month. The report is designed to inform the Board of Directors about key financial metrics and trends to guide strategic decision-making. It emphasizes a caring, safe, and excellent approach to financial management, ensuring transparency and accountability within the organization.
Download Presentation

Please find below an Image/Link to download the presentation.
The content on the website is provided AS IS for your information and personal use only. It may not be sold, licensed, or shared on other websites without obtaining consent from the author.If you encounter any issues during the download, it is possible that the publisher has removed the file from their server.
You are allowed to download the files provided on this website for personal or commercial use, subject to the condition that they are used lawfully. All files are the property of their respective owners.
The content on the website is provided AS IS for your information and personal use only. It may not be sold, licensed, or shared on other websites without obtaining consent from the author.
E N D
Presentation Transcript
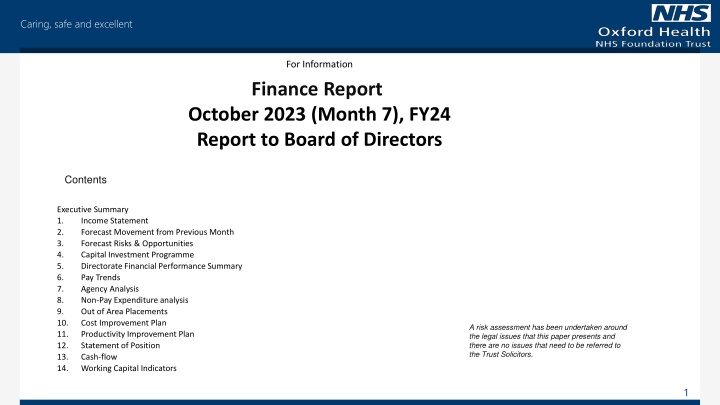
Caring, safe and excellent For Information Finance Report October 2023 (Month 7), FY24 Report to Board of Directors Contents Executive Summary 1. Income Statement 2. Forecast Movement from Previous Month 3. Forecast Risks & Opportunities 4. Capital Investment Programme 5. Directorate Financial Performance Summary 6. Pay Trends 7. Agency Analysis 8. Non-Pay Expenditure analysis 9. Out of Area Placements 10. Cost Improvement Plan 11. Productivity Improvement Plan 12. Statement of Position 13. Cash-flow 14. Working Capital Indicators A risk assessment has been undertaken around the legal issues that this paper presents and there are no issues that need to be referred to the Trust Solicitors. 1
Caring, safe and excellent Executive Summary Capital Expenditure YTD - 2.6m better than plan Forecast - 2.8m worse than funding available Income & Expenditure position YTD - 1.0m better than plan Forecast on plan Risks 12.1m Opportunities 16.1m Net 4.0m upside Cash Actual 89.8m, 18.3m better than plan Highlights: The month 7 YTD position is a surplus of 2.8m, 1.0m favourable to plan. The forecast is a surplus of 3.2m, on plan. There are 12.1m of risks and 16.1m of opportunities to the forecast. This gives a forecast range of between 16.1m better than plan and 12.1m worse than plan. Taking into account only those risks and opportunities assessed as high likelihood there is a forecast range of between 2.3m better than plan and 4.3m worse than plan. The Directorates forecasting adverse variances to budget are: Forensic Mental Health 0.6m, Learning Disabilities 0.9m, Provider Collaboratives 0.2m, Primary, Community and Dental Care 0.5m, Corporate 0.5m and Block Income 1.5m. At month 7 22.0m has been spent on agency staff, which is 10.5% of total staff costs. The Trust s agency target set by NHS England for FY24 is 32.2m. The agency forecast in directorate positions is 37.4m. This is mainly based on YTD trend and does not take into account any further improvements from the ID Medical and NHSP contracts. When these are taken into account the forecast is 35.5m. 4.9m of the 7.2m CIP target has been delivered so far. Further work is needed to identify schemes for the remaining 2.3m. The Trust has a 11.0m PIP target to be met through a reduction in temporary staffing spend. 5.5m of savings have been made so far. Capital expenditure is reporting a 2.6m underspend YTD. The forecast is for a 2.8m overspend against the funding available. Cash remains strong with a cash balance of 89.8m. 2
Caring, safe and excellent 1. Income Statement Year-to-Date Performance The month 7 YTD position is a surplus of 2.8m, 1.0m favourable to plan. EBITDA is 0.6m favourable to plan and Financing costs are 0.4m favourable to plan. The adverse variance on income ( 3.2m) is made up of 4.7m on Provider Collaboratives where income has been deferred to match lower spend offset with 1.2m higher sales in Oxford Pharmacy Store and 0.3m additional income in Research & Development. The favourable variance on expenditure ( 3.8m) is made up of 4.7m in Provider Collaboratives (offset with income) offset with 1.1m higher cost of sales in Oxford Pharmacy Store. The month 7 variances on income and expenditure are due to a change in the expenditure accruals in Provider Collaboratives to more accurately reflect the current position. This also affects the amount of income that is deferred. 3
Caring, safe and excellent 2. Forecast movement from previous month 4
Caring, safe and excellent The month 7 forecast worsened by 29k from the forecast at month 6 and the graph above illustrates the main movements. The increase in the agency forecast is due to an increase in month for retrospective shifts in August and September. The forecast for Mental Health and Learning Disabilities out of area placements has increased due to new admissions in month. The increase in income from BOB ICS is due to the ICS paying for some items which were previously not agreed but there are still outstanding income issues to resolve. 5
Caring, safe and excellent 3. Forecast Risks & Opportunities Risks Actions needed from SEND review '000 1,000 Likelihood High The Trust s Forecast Outturn is for a 3.2m surplus, which isonplan. Contracting issues with BOB ICS Capital to revenue transfer Winter pressures Increase in OAPs Annual leave buy back accrual 3,300 1,000 1,000 300 300 High Medium Medium Medium Medium There are 12.1m of risks and 16.1m of opportunities to the forecast. This gives a forecast range of between 16.1m better than plan and 12.1m worse than plan. Taking into account only those risks and opportunities assessed as high likelihood there is a forecast range of between 2.3m better than plan and 4.3m worse than plan. Additional spend against Deferred Income Balance Sheet/Audit Income risks Microsoft Licenses Additional LD OAPs 200 3,000 1,250 500 250 12,100 Medium Low Low Low Low The Trust is expecting 6.4m of additional income from the BOB ICS but this has yet to be agreed. 3.4m of this is already in the forecast. This includes 2.4m of income for S117 social care placement costs which is assumed in our forecast but not agreed by BOB ICB. 3.0m has been included as a risk and opportunity for any requirement to adjust balance sheet values with an effect on the revenue position. Opportunities Additional central funding for Industrial Action Wellbeing Day Agency reduction Contracting issues with BOB ICS Modern Equivalent Assets valuation AL provision Additional release of PC deferred income Agreement on old NHS PS invoices Discharge of LD OAPs patients MHIS investment spend less than forecast Reduction in OAPs Increase in income to support AED PC R&D CRF building work Balance Sheet/Audit Contracting issues with BOB ICS '000 Likelihood 1,300 990 3,097 1,296 1,000 939 900 650 344 240 200 200 180 3,000 1,800 16,136 High High Medium Medium Medium Medium Medium Medium Medium Medium Medium Medium Medium Low Low Forecast range - all risks and opportunities Forecast range - high likelihood risks and opportunities Forecast Outturn to Plan 16,131 -12,105 Forecast Outturn to Plan 2,285 -4,305 Full Year Budget Full Year Actual Full Year Budget Full Year Actual '000 '000 Upside Forecast Downside Forecast 3,312 3,312 19,443 -8,793 Upside Forecast Downside Forecast 3,312 3,312 5,597 -993 6
Caring, safe and excellent 4. Capital Investment Programme The Trust spent 6,118k on its capital programme in the first 7 months of the year against a year-to date expenditure budget of 8,734k, an underspend of 2,616k. The Trust has a forecast outturn of 19,176k, which represents an overspend against plan of ( 1,457k) and a funding deficit of ( 2,796k). It is likely that this position will be mitigated by slippage, and the ICB also have additional capital available. However, plans are in place to mitigate this cost pressure by deferring projects if needed. 7
Caring, safe and excellent 5. Directorate Financial Performance Summary Month 7 Year-to-date Forecast Plan m (9.4) (4.4) (2.6) (0.5) 1.1 (15.8) (8.1) (6.2) 0.0 (0.0) (0.0) (0.6) 32.3 1.6 1.3 0.0 0.3 Actual m (8.3) (4.4) (2.4) (0.8) Variance Plan m (65.8) (30.6) (17.9) (3.4) 7.5 (110.2) (58.1) (42.9) Actual m (64.0) (30.7) (18.0) (4.1) Variance Plan m (113.2) (52.5) (30.7) (5.8) 12.8 (189.3) (98.5) (73.9) Forecast Variance Directorate Oxfordshire & BSW Mental Health Buckinghamshire Mental Health Forensic Mental Health Learning Disabilities Provider Collaboratives MH Directorates Total Primary Community & Dental Care Corporate Oxford Pharmacy Store Research & Development Covid-19 Costs Reserves Block Income EBITDA Financing Costs Adjustments Adjsuted Surplus/(Deficit) m 1.2 (0.1) 0.1 (0.4) (0.0) 0.9 (0.0) 0.6 0.0 (0.1) 0.0 (1.3) 0.1 0.2 (0.0) 0.0 0.2 m 1.8 (0.1) (0.1) (0.7) 0.0 0.8 0.4 0.1 0.1 0.2 0.0 (0.1) (1.0) 0.6 0.4 (0.0) 1.0 m m 1.0 0.2 (0.6) (0.9) (0.2) (0.5) (0.5) (0.5) 0.5 0.2 0.0 1.3 (1.5) (1.0) 1.0 (0.0) (0.0) (112.2) (52.3) (31.3) (6.6) 12.6 (189.9) (99.0) (74.4) 1.1 7.5 (14.9) (8.1) (5.8) 0.0 (0.1) 0.0 (1.9) 32.4 1.7 1.3 (0.0) 0.4 (109.4) (57.6) (42.8) 0.1 (0.3) (0.0) (3.5) 225.9 11.1 9.3 0.0 1.9 0.3 (0.0) 0.0 (3.6) 224.9 11.7 8.9 0.0 2.8 0.4 (0.5) (0.0) (5.3) 386.3 19.1 15.9 (0.1) 3.2 0.8 (0.3) 0.0 (4.0) 384.8 18.1 14.9 (0.1) 3.2 Block contract income is reported in a separate directorate. Clinical Directorate positions reflect the expenditure position less non-clinical income (mainly Education & Training income) and some specific income streams such as Sustainability & Development Funding (SDF). The forecast overspend on Provider Collaboratives (PCs) relates to the Adult Eating Disorders PC. The Secure and CAMHS PCs are forecasting underspends but the forecast for the Trust position is on plan as it is assumed that the underspends will be carried forward into next year for re-investment. 8
Caring, safe and excellent 6. Pay Trends The increase in pay costs and budget in September 2022 reflect when the pay award was paid to staff along with back pay. The increased costs in March 2022 reflect year-end accounting adjustments for pension costs The increase in costs in March 2023 again reflect year-end accounting adjustments for pension costs and also an accrual for the government proposed back-dated non-consolidated pay award. The 2023-24 pay award was paid in June 2023 and budgets and substantive costs include 3 months' worth of costs in month. Agency costs in September 2023 have reduced due to a YTD correction of hourly rate costs. 9
Caring, safe and excellent Agency costs have increased significantly in Learning Disabilities due to the costs associated with one patient on 10:1 observations. This patient was discharged on 9th October but due there was a catch-up of YTD costs in the Finance system for this in October. 11
Caring, safe and excellent Corporate substantive costs reduced in August due to transfer YTD staff costs to capital from Digital & Transformation. 12
Caring, safe and excellent 7. Agency Analysis At month 7 22.0m has been spent on agency staff, which is 10.5% of total staff costs. This includes 0.4m to support one patient on 10:1 observations, who was discharged on the 9th October. These figures and the graphs above now include agency spend related to Covid vaccinations from April, but the figures from previous years still exclude this spend. The Trust s agency target set by NHS England for FY24 is 32.2m.The agency forecasts in directorate positions is 37.4m. This is mainly based on YTD trend and does not take into account any further improvements from the ID Medical and NHSP contracts. When these are taken into account the forecast is 35.5m. 13
Caring, safe and excellent 8. Non-Pay Expenditure Analysis '000s Category of Spend Clinical Supplies & Services Drugs Establishment General Supplies And Services Other Oxford Pharmacy Store Cost of Sales Premises Provider Collaborative Contracts Purchase of Services R&D non-staff costs Reserves Transport Month 7 Year-to-Date Budget Actual Variance % Variance Budget 10,947 2,449 5,378 2,074 8,979 21,993 7,521 39,943 5,932 9,174 4,347 3,956 122,694 Actual 13,973 2,929 6,832 2,104 9,337 23,628 10,338 35,315 7,334 9,397 Variance -3,026 % Variance 1,474 350 704 328 869 3,262 1,249 5,706 847 1,314 556 841 17,500 1,953 420 1,115 317 939 3,772 1,094 10,973 968 919 -479 -70 -411 11 -70 -510 155 -5,267 -120 396 556 319 -5,491 -33% -20% -58% 3% -8% -16% 12% -92% -14% 30% 100% 0% -31% -28% -20% -27% -1% -4% -7% -37% 12% -24% -2% 100% 0% -2% -480 -1,454 -31 -357 -1,635 -2,816 4,628 -1,402 -223 4,347 495 -1,954 0 0 523 3,462 124,648 22,991 Clinical Supplies & Services are overspent by 3.0m YTD driven by 0.7m in Childrens Continuing Care (offset by additional income), 0.6m for out of area placements in Learning Disabilities, 0.2m for beds in Community Hospitals (agreed as spend in FY23 but they did not arrive until July), 0.8m for equipment and supplies spend in the Primary, Community and Dental Care directorate, 0.5m in the Oxfordshire & BSW and Buckinghamshire Mental Health directorates mainly on sub-contracts with providers to assist with waiting lists where services have vacancies and a 0.2m net adverse variance across other areas. The overspend on Drugs costs is made up of overspends across all clinical areas. The overspend on Establishment costs is driven by IT related costs in services e.g. software licenses fees and purchase of IT hardware. The overspend on Other is driven by the bad debt provision. The overspend on Oxford Pharmacy Store Cost of Sales is offset by additional sales income. The overspend on Premises costs is driven by a 1.8m overspend in Estates & Facilities costs due to pressures contracts and property costs, 0.5m spend on furniture, 0.2m new works costs in directorates, 0.2m due to prior year electricity costs for the Covid vaccinations centres and a 0.1m net overspends in other areas. The underspend on Provider Collaboratives contracts reflects lower than planned spend and this is offset by an adverse variance on income. Purchase of Services is overspent by 1.4m YTD driven by Mental Health Out of Area Placement costs - 1.0m overspent in Oxfordshire and 0.7m overspend in Buckinghamshire. These are offset by 0.3m of extra packages of care income in Forensics (reported in non-pay as it is a transfer from Provider Collaboratives). R&D non-staff costs are the costs invoiced by partner organisations and the overspend is offset with a favourable variance on income. The Reserves budget is the contingency held by the Trust to offset pressures elsewhere. The Transport underspend is driven by an underspend on business mileage costs. 14
Caring, safe and excellent 9. Out of Area Placements (OAPs) Out of Area Placements are 1.6m adverse at month 7, 951k adverse in Oxfordshire and 739k adverse in Buckinghamshire. This includes the cost of the 4 block beds contract with Elysium. Plus, a further 2 block beds which were added to the contract in month 6, originally for 3 months but has now been extended to 31st January 2024. This is due to the continuous high demand on the service's acute beds. These costs exclude Secure Transport spend which is currently 92k across the two directorates. 15
Caring, safe and excellent Oxon & Bucks OAPS Spend by bed type The above graphs show a sharp increase in month 1 of FY23. This is due to allocations of costs prior to FY23 being reclaimed from national COVID funding. Oxfordshire s FY23 month 4 decrease was due to the release of an FY21 provision. The sharp decrease in Buckinghamshire in FY23 month 8 was also due to a release of an old year provision. At Month 7 the Services Acute Beds remain steady, as the addition of 2 Chadwick Lodge Block Beds has helped stabilise cost and reduce spot purchases . Oxfordshire PICU Beds have slightly increased from 1 to 3 beds with longer length of stay. Other placements remain steady. Buckinghamshire Acute Bed days have decreased but have some large observation costs coming through, PICU Placements have increased in month but have only a short length of stay. They continue to have 1 Long Stay patient in a Rehab bed. At the end of October Oxfordshire have 9 Acute, 3 PICU, 4 Rehab, 1 Specialist Care Placement & 1 Continuing Care patients still out & Buckinghamshire have 4 Acute, 3 PICU & 1 Rehab patient still out of area. 16
Caring, safe and excellent 10. . Cost Improvement Programme (CIP) The Trust s external CIP target as reported to NHSE is 16.1m made up of a 5.1m efficiency from contract uplifts (CIP) and 11.0m cost management (Productivity Improvement Programme (PIP). The Trust continues to report a forecast full delivery of the 16.1m to NHS England on the assumption that any shortfall in these programmes will be mitigated by other non-recurrent benefits in the Trust s position. Internally the Trust has an additional 2.1m CIP for FY23 CIPs that were not delivered recurrently last year, making the total internal CIP target 7.2m. 4.9m of the 7.2m CIP target has been delivered so far through CIPs made up front from investment funding and a 1.0m saving in HR from the Temporary Staffing team following the transfer to NHSP. A Finance Business Partner has just been appointed to lead on efficiency programmes to help develop plans for the remaining 2.3m. '000s Community Oxon & BSW MH Bucks MH Forensics Learning Disabilities Provider Collaboratives Corporate NHSP transfer (internal bank team costs) Total CIP YTD Plan YTD Actual YTD Variance 583 848 468 359 0 17 0 583 2,859 Full Year Plan Forecast Forecast Variance 1,937 1,000 1,778 1,454 803 803 615 615 106 29 948 1,000 1,000 7,216 4,901 1,130 1,037 468 359 -547 -189 -937 -324 0 0 0 0 62 17 553 583 -62 0 -106 0 29 0 0 -553 -948 0 0 4,209 -1,350 -2,315 17
Caring, safe and excellent 11. . Productivity Improvement Programme (PIP) The 11.0m PIP target is to be met through a reduction in temporary staffing spend including the cost reduction from moving from agency to bank staff as well as a reduction in demand for temporary staffing. This is being calculated as the YTD reduction in spend between FY23 and FY24 (excluding the Covid mass vaccination centre spend). At month 7 5.5m of savings have been made, which is 0.1m lower than the YTD target. The forecast spend is 6.4m lower than FY23 spend which is 4.7m below the target. This shortfall is being offset by vacancies. The forecast may improve as the current forecast does not take into account further improvements in performance by ID Medical and NHSP. The performance against the PIP target is different to the performance against the agency spend target. For the latter any reduction in agency spend counts towards this target. For the PIP target it is only reduction in agency spend which results in an overall cost saving to the Trust that can be regarded as a PIP saving. For example, if the same number of hours move from agency to bank there will be a saving against both targets. But, if spend moves to bank and demand increases then there won t be a reduction in costs so no PIP savings. Full Year Actual/Forecast '000s FY23 Bank FY23 Agency Total FY23 M1 2,463 4,322 6,785 M2 M3 M4 M5 M6 M7 YTD 2,008 3,417 5,425 2,218 2,803 2,135 3,366 1,793 16,786 5,041 3,681 3,920 3,760 4,741 28,882 7,259 6,484 6,055 7,126 6,534 45,668 29,627 44,761 74,388 FY24 Bank FY24 Agency Total FY24 2,946 2,922 5,868 2,390 3,253 5,643 2,542 2,493 2,667 2,499 2,680 18,217 3,351 3,127 2,594 3,474 3,275 21,996 5,893 5,620 5,261 5,973 5,954 40,212 30,642 37,394 68,036 Savings Target Variance 917 920 -3 -1,138 -218 920 1,366 920 446 864 920 -56 794 1,153 920 -126 580 920 5,456 5,522 -66 6,352 11,043 -4,691 920 233 -341 18
Caring, safe and excellent 12. Statement of Financial Position Statement of Financial Position as at 31st October 2023 31 March 2023 Movement Month 6 FY24 Month 7 FY24 1. Non-current assets have decreased by ( 1.1m) in-year. The decrease is due to cumulative depreciation of ( 8.2m) offsetting capital additions of 7.1m (including 1.0m of net leased assets). Year to date '000 In month '000 '000 '000 '000 Non-current assets Intangible Assets Property, plant and equipment Finance Leases Investments Trade and other receivables Other Assets 2. Trade and other receivables decreased by 13.6m in year and increased by 2.8m in month. Most of the decrease in-year is due to a decrease in outstanding debt of 8.0m and accrued income of 6.5m. The increase in month is due to an increase in accrued income and new debt and a reduction in VAT receivables. 4,977 216,636 30,850 1,125 5,831 216,602 28,936 1,125 5,813 217,041 28,469 1,125 836 405 (18) 439 (467) (2,381) 0 0 1 0 0 1 519 485 519 485 519 486 3. The cash balance has increased by 15.2m over the year and 8.4m in month. The in- year increase is mainly driven by an increase in cash generated from operations see note 13. The cash flow statement. (46) 254,592 Total non-current assets 253,499 253,452 (1,140) Current Assets Inventories Trade and other receivables Cash and cash equivalents Total current assets 2,932 35,207 74,610 112,749 2,482 18,719 81,397 102,598 2,777 21,637 89,760 114,174 (155) 295 2,918 8,363 11,576 4. Trade and other payables have decreased by 12.2m in year and increased by 10.6m in month. The decrease in-year is largely due to a fall in trade payables and accrued expenditure of 11.2m, and the increase in month is due to a corresponding increase in trade payable and accrued expenditure. (13,570) 15,150 1,424 Current Liabilities Trade and other payables Borrowings Other financial liabilities Finance Leases Provisions Deferred income (83,398) (2,019) (60,539) (2,022) (1,930) (5,371) (2,247) (33,664) (71,160) (2,070) (1,930) (5,371) (2,252) (34,844) 12,238 (51) (1,930) (10,620) (48) 5. Deferred income has increased by 11.4m in year and 1.2m in-month. Most of the in- year increase can be attributed to the Provider Collaborative ( 6.6m) and advanced payments from Health Education England ( 3.8m) which will unwind over the third quarter. 0 0 0 (5,374) (2,249) (23,002) 3 (3) (4) 6. Finance Leases liabilities (IFRS16) have decreased by 3.0m in year and 0.6m in month due to capital repayments. (11,842) (1,180) (116,042) Total Current Liabilities (105,774) (117,626) (1,584) (11,852) Non-current Liabilities Borrowings Finance Leases Provisions Total non-current liabilities Total assets employed 7. The in-year and in-month movements in the I&E reserves reflects the Trust's reported surplus position for the same time periods. (14,640) (19,982) (6,085) (40,706) 210,592 (13,642) (17,631) (5,990) (37,264) 213,059 (13,588) (17,015) (5,934) (36,537) 213,463 1,052 2,967 151 4,169 2,871 55 616 56 726 404 Financed by (taxpayers' equity) Public Dividend Capital Revaluation reserve Other reserves Income & expenditure reserve 109,631 82,587 1,125 17,250 109,631 82,589 1,125 19,714 109,631 82,589 1,125 20,117 1 2 0 0 0 0 2,868 404 210,592 Total taxpayers' equity 213,059 213,463 2,870 404 19
Caring, safe and excellent 13. Cash Flow STATEMENT OF YEAR TO DATE CASH FLOWS Summary Notes Month 7 FY24 The cash flow movements are consistent with the comments made on the Statement of Financial Position. Actual '000 Plan Variance '000 '000 Cash flows from operating activities Operating surplus/(deficit) from continuing operations Operating surplus/(deficit) The closing cash position at the end of September was 89.8m. 3,551 3,551 507 507 3,045 3,045 Non-cash income and expense: Depreciation and amortisation (Increase)/Decrease in Trade and Other Receivables (Increase)/Decrease in Inventories Increase/(Decrease) in Trade and Other Payables Increase/(Decrease) in Deferred Income Increase/(Decrease) in Provisions NET CASH GENERATED FROM/(USED IN) OPERATIONS 8,202 13,579 155 (12,740) 13,772 (149) 26,370 8,365 2,395 245 (5,537) 2,034 135 8,143 (163) 11,185 (90) (7,203) 11,738 (285) 18,227 Cash flows from investing activities Interest received Purchase of Non Current Assets Net cash generated from/(used in) investing activities 2,853 (6,515) (3,661) 2,258 (7,413) (5,155) 595 898 1,494 Cash flows from financing activities Loans repaid Capital element of lease rental payments Capital element of Private Finance Initiative Obligations Interest paid Interest element on leases Interest element of Private Finance Initiative obligations PDC Dividend paid Net cash generated from/(used in) financing activities (669) (3,903) (328) (291) (119) (829) (1,420) (7,559) (669) (2,877) (300) (317) (147) (482) (1,310) (6,102) 0 (1,026) (28) 26 28 (347) (110) (1,457) 15,150 74,610 89,760 (3,114) 74,610 71,496 18,264 Increase/(decrease) in cash and cash equivalents Cash and Cash equivalents at 1st April Cash and Cash equivalents at 31st October 0 18,264 20
Caring, safe and excellent 14. Working Capital Indicators Working Capital Ratios Ratio Target Actual Risk Status Debtor Days 30 24 Debtors % > 90 days 5.0% 8.6% BPPC NHS - Value of Inv's pd within target (ytd) 95.0% 94.1% BPPC Non-NHS - Value of Inv's pd within target (ytd) 95.0% 93.8% Cash ( m) 69.6 89.8 Summary Notes Debtor days are ahead of target. Debtors % over 90 days is marginally below target, due to unpaid invoices. These are mainly Provider Collaboratives 276k, various ICB s 131k, Salary overpayments 355k, NHS Property Services 154k, HEE ( 829k), NHSE 31k and other 508k. NHS BPPC (Better Payments Practice Code) is marginally below target (81.1% in Oct) Non-NHS BPPC (Better Payments Practice Code) is marginally below target (85.7% in Oct) Cash is better than plan, as outlined in section 9. 21
