Financial Business Plan Presentation Template for Long-Term Growth
This 5-year financial business plan template provides a comprehensive framework for outlining revenue projections, expense forecasts, profit and loss statements, cash flow analysis, funding requirements, and key performance indicators. Ideal for strategic planning and securing financial backing.

Download Presentation

Please find below an Image/Link to download the presentation.
The content on the website is provided AS IS for your information and personal use only. It may not be sold, licensed, or shared on other websites without obtaining consent from the author. If you encounter any issues during the download, it is possible that the publisher has removed the file from their server.
You are allowed to download the files provided on this website for personal or commercial use, subject to the condition that they are used lawfully. All files are the property of their respective owners.
The content on the website is provided AS IS for your information and personal use only. It may not be sold, licensed, or shared on other websites without obtaining consent from the author.
E N D
Presentation Transcript
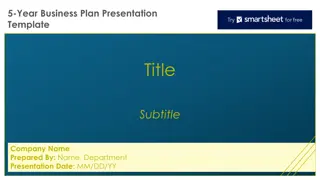
5-Year Financial Business Plan Presentation Template Business Plan Title Subtitle Company Name Prepared By: Name, Department Presentation Date: MM/DD/YY
Contents 1. 2. 3. 4. 5. 6. 7. 8. 9. Executive Summary Revenue Projections Expense Projections Profit and Loss (P&L) Statement Cash Flow Projections Funding Plan Break-Even Analysis Key Performance Indicators (KPIs) Appendices
1. Executive Summary Plan Overview Description. Financial Snapshot Metric Year 1 Year 2 Year 3 Year 4 Year 5 Revenue ($) Net Profit Margin (%) Funding Needed ($)
2. Revenue Projections Revenue Forecast Description Revenue Drivers Description Product/Service Year 1 Year 2 Year 3 Year 4 Year 5 Smart Solar Panels Installation Services SaaS Subscriptions Total Revenue
3. Expense Projections Operating Expenses (OPEX) Description Costs of Goods Sold (COGS) Description Category Year 1 Year 2 Year 3 Year 4 Year 5 Staffing Costs Marketing Expenses R&D Costs Administrative Costs Total Revenue
4. Profit and Loss (P&L) Statement Overview Description Year Revenue ($) COGS ($) Gross Profit ($) OPEX ($) Net Profit ($) Year 1 Year 2 Year 3 Year 4 Year 5
5. Cash Flow Projections Cash Management Description Year Opening Balance ($) Cash Inflows ($) Cash Outflows ($) Closing Balance ($) Year 1 Year 2 Year 3 Year 4 Year 5
6. Funding Plan Funding Requirements Description Use of Funds Year 1 Year 2 Year 3 Product Development Marketing Operational Setup Total Funds Required
7. Break-Even Analysis Profitability Timeline Description Year Revenue ($) Fixed Costs ($) Variable Costs ($) Break-Even Revenue ($) Year 1 Year 2 Year 3
8. Key Performance Indicators (KPIs) Category KPI Year 1 Target Year 2 Target Year 3 Target Year 4 Target Year 5 Target Revenue Growth (%) 87.50% 87.50% 100.00% 83.30% 81.80% Gross Profit Margin (%) 50.00% 55.00% 60.00% 62.00% 65.00% Financial Net Profit Margin (%) 12.00% 15.00% 18.00% 22.00% 25.00% EBITDA Margin (%) 15.00% 17.00% 20.00% 25.00% 28.00% Revenue per Employee ($) $50,000.00 $75,000.00 $100,000.00 $125,000.00 $150,000.00 Customer Acquisition Cost (CAC) ($) $50.00 $45.00 $35.00 $30.00 $25.00 Operational Retention Rate (%) 70.00% 75.00% 80.00% 85.00% 90.00%
9. Appendices Document Type Description Purpose
DISCLAIMER Any articles, templates, or information provided by Smartsheet on the website are for reference only. While we strive to keep the information up to date and correct, we make no representations or warranties of any kind, express or implied, about the completeness, accuracy, reliability, suitability, or availability with respect to the website or the information, articles, templates, or related graphics contained on the website. Any reliance you place on such information is therefore strictly at your own risk.


 Statement")


")