Financial Insights and Trends 2020-2021
Gain valuable insights into the financial performance of District Northwest from 2020 to 2021, including income, expenses, and investment outcomes. Explore the year-end balances, membership growth, and key financial highlights in this comprehensive report.

Download Presentation

Please find below an Image/Link to download the presentation.
The content on the website is provided AS IS for your information and personal use only. It may not be sold, licensed, or shared on other websites without obtaining consent from the author. If you encounter any issues during the download, it is possible that the publisher has removed the file from their server.
You are allowed to download the files provided on this website for personal or commercial use, subject to the condition that they are used lawfully. All files are the property of their respective owners.
The content on the website is provided AS IS for your information and personal use only. It may not be sold, licensed, or shared on other websites without obtaining consent from the author.
E N D
Presentation Transcript
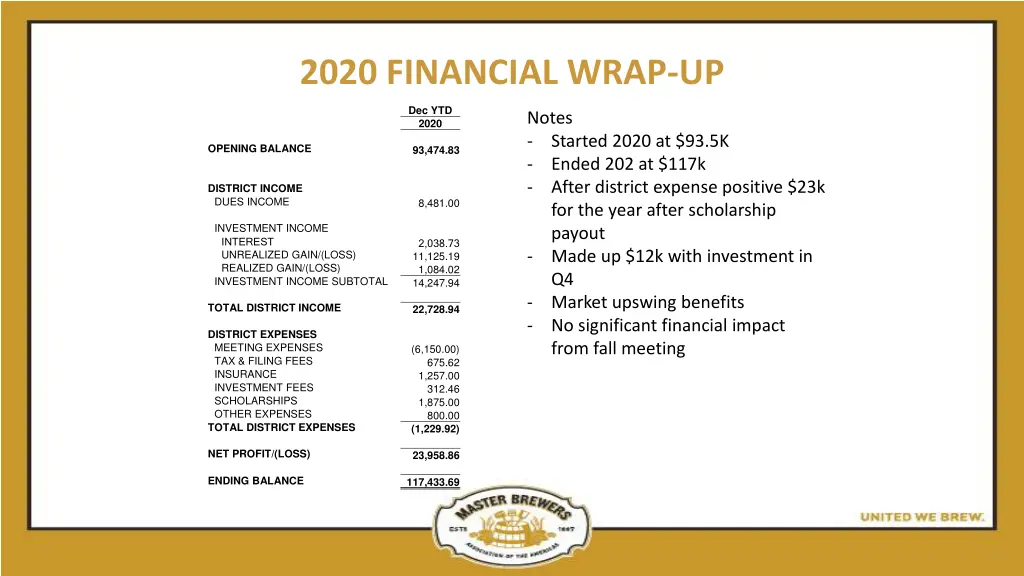
2020 FINANCIAL WRAP-UP Dec YTD 2020 Notes - - - Started 2020 at $93.5K Ended 202 at $117k After district expense positive $23k for the year after scholarship payout Made up $12k with investment in Q4 Market upswing benefits No significant financial impact from fall meeting OPENING BALANCE 93,474.83 DISTRICT INCOME DUES INCOME 8,481.00 INVESTMENT INCOME INTEREST UNREALIZED GAIN/(LOSS) REALIZED GAIN/(LOSS) INVESTMENT INCOME SUBTOTAL 2,038.73 11,125.19 1,084.02 14,247.94 - - - TOTAL DISTRICT INCOME 22,728.94 DISTRICT EXPENSES MEETING EXPENSES TAX & FILING FEES INSURANCE INVESTMENT FEES SCHOLARSHIPS OTHER EXPENSES TOTAL DISTRICT EXPENSES (6,150.00) 675.62 1,257.00 312.46 1,875.00 800.00 (1,229.92) NET PROFIT/(LOSS) 23,958.86 ENDING BALANCE 117,433.69
Financial 2021 YTD Financial 2021 YTD Jan 2021 Feb 2021 Mar 2021 Mar YTD 2021 OPENING BALANCE 117,433.69 117,890.64 118,546.93 117,433.69 DISTRICT INCOME DUES INCOME 820.00 1,005.00 580.00 2,405.00 INVESTMENT INCOME INTEREST UNREALIZED GAIN/(LOSS) REALIZED GAIN/(LOSS) INVESTMENT INCOME SUBTOTAL 80.54 (413.05) 0.00 (332.51) 76.30 58.88 215.72 (422.17) 1,711.95 1,505.50 1,021.45 0.00 1,097.75 (1,030.57) 1,711.95 740.26 TOTAL DISTRICT INCOME 487.49 2,102.75 1,320.26 3,910.50 DISTRICT EXPENSES MEETING EXPENSES INSURANCE INVESTMENT FEES TOTAL DISTRICT EXPENSES 0.00 0.00 30.54 30.54 140.00 1,276.00 30.46 1,446.46 0.00 0.00 30.76 30.76 140.00 1,276.00 91.76 1,507.76 NET PROFIT/(LOSS) 456.95 656.29 1,289.50 2,402.74 ENDING BALANCE 117,890.64 118,546.93 119,836.43 119,836.43 District Northwest District Northwest District Northwest District Northwest May 21 May 21st st 2021 May 21 May 21st st 2021 2021 2021
End of year balance tracker End of year balance tracker $140,000.0 $120,000.0 $100,000.0 $80,000.0 $60,000.0 $40,000.0 $20,000.0 $0.0 2015 2016 2017 2018 2019 2020 2021 District Northwest District Northwest May 21 May 21st st 2021 2021
District NW Membership 2015 District NW Membership 2015- -2021 2021 600 500 400 300 200 100 0 2015 2016 2017 2018 2019 2020 2021 District Northwest District Northwest May 21 May 21st st 2021 2021