Financial Overview and Resource Allocation
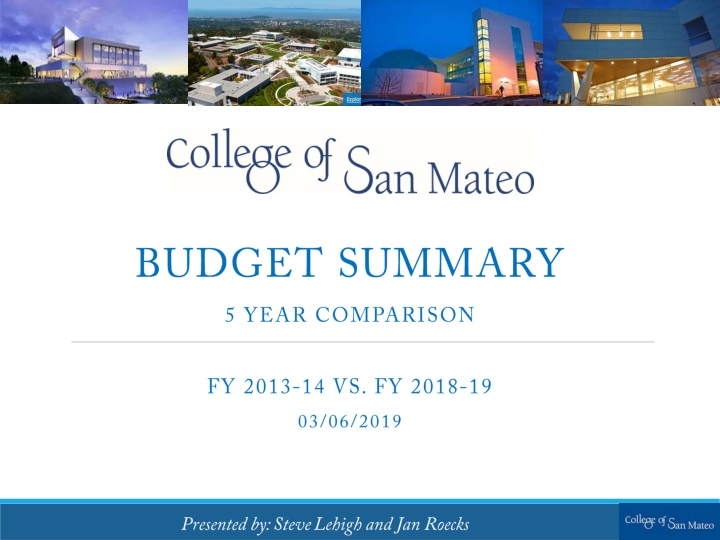
The data showcases financial details including fund allocations, student fees, benefits, staffing variances, and program initiatives within the education institution. It highlights changes in funds, student populations, benefits expenditure, and staff distribution over the years. The visual representations depict the shifts in resource distribution and support programs aimed at student success and institutional enhancement.

Download Presentation

Please find below an Image/Link to download the presentation.
The content on the website is provided AS IS for your information and personal use only. It may not be sold, licensed, or shared on other websites without obtaining consent from the author.If you encounter any issues during the download, it is possible that the publisher has removed the file from their server.
You are allowed to download the files provided on this website for personal or commercial use, subject to the condition that they are used lawfully. All files are the property of their respective owners.
The content on the website is provided AS IS for your information and personal use only. It may not be sold, licensed, or shared on other websites without obtaining consent from the author.
E N D
Presentation Transcript
FY 2013-14 FY 2018-19 Variance FTES 6,989 5,908 -1,081 FTES International 203 732 529 Total FTES 7,192 6,640 -552
Instructional Equipment (Fund 4), $0.5M, 1% State and Federal Restricted Funds (Fund 3), $11M, 19% Other, $0.6M, 1% Non-Resident Student Fees , $5.7M, 10% Property Taxes , $34.2M, 61% Resident Student Fees , $4.6M, 8% General Funds (Fund 1), $45.1M, 80%
FY 2013-14 FY 2018-19 Variance General Funds (Fund 1) & Instructional Equipment Funds $31.9M $45.6M $13.7M State and Federal Restricted Funds (Fund 3) $4.4M $11.0M $6.6M Total $36.3M $56.6M $20.3M
Benefits (COLA, Step & Column, STRS, PERS, etc.) FY 1314 to FY 1415 $1.0M FY 1415 to FY 1516 $1.6M FY 1516 to FY 1617 $2.8M FY 1617 to FY 1718 $2.9M FY 1718 to FY 1819 $3.0M Total Ongoing Positions $11.3M 57 Additional Positions/Release Time over the last 5 years $9.0M Total Increase in Benefits $20.3M
FY 2013-14 FY 2018-19 Variance Administration 13 13 0 Faculty 129 152 23 Classified 112 146 34 Total 254 311 57
FY 2013-14 FY 2018-19 Variance Instructional 100 107 7 Counseling 15 20 5 Academic Supervisory 5 8 3 Release Time (Coordination/Professional Development Leave) 9 17 8 Total 129 152 23
Year One Promise AB 705- Math Instructors International Education Student Success Support Program/Student Equity/ Basic Skills Initiative Hispanic Serving Institute (HSI) Strong Workforce Math Engineering Science Achievement (MESA) Learning Communities Guided Pathways Small Business Development Center