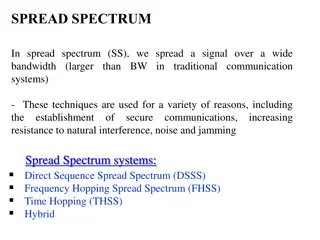
Financial Reporting Quality and Earnings Spectrum
This content delves into the intricacies of financial reporting quality, highlighting the interrelation between financial reporting quality and earnings quality. It discusses the spectrum of financial reports, emphasizing the impact of biased accounting choices, assumptions, and estimates on reported outcomes using real-life examples such as Toyota Motor Corporation and Trump Hotels & Casino Resorts.

Download Presentation

Please find below an Image/Link to download the presentation.
The content on the website is provided AS IS for your information and personal use only. It may not be sold, licensed, or shared on other websites without obtaining consent from the author.If you encounter any issues during the download, it is possible that the publisher has removed the file from their server.
You are allowed to download the files provided on this website for personal or commercial use, subject to the condition that they are used lawfully. All files are the property of their respective owners.
The content on the website is provided AS IS for your information and personal use only. It may not be sold, licensed, or shared on other websites without obtaining consent from the author.
E N D
Presentation Transcript
FINANCIAL REPORTING QUALITY Presenter s name Presenter s title dd Month yyyy
FINANCIAL REPORTING QUALITY VS. QUALITY OF REPORTED RESULTS Financial Reporting Quality Decision-useful information Faithful representation of economic reality Compliant with standards Quality of Reported Results (aka Earnings Quality ) Sustainable activity Adequate returns Increases the company s value 2
FINANCIAL REPORTING QUALITY AND EARNINGS QUALITY ARE INTERRELATED 3
QUALITY SPECTRUM OF FINANCIAL REPORTS Excerpt from Toyota Motor Corporation s Consolidated Financial Results Consolidated vehicle unit sales in Japan and overseas decreased by 37 thousand units, or 1.6%, to 2,232 thousand units in FY2014 first quarter compared with FY2013 first quarter operating income increased by 310.2 billion, or 87.9%, to 663.3 billion in FY2014 first quarter compared with FY2013 first quarter. The factors contributing to an increase in operating income were the effects of changes in exchange rates of 260.0 billion... 5
QUALITY SPECTRUM OF FINANCIAL REPORTS Biased accounting choices, assumptions, estimates: - Aggressive choices increase a company s reported performance and financial position in the current period. - Conservative choices decrease current reported performance but may increase future reported. Biased presentation choices: - Obscure unfavorable information and/or - Emphasize favorable information. 6
QUALITY SPECTRUM OF FINANCIAL REPORTS TRUMP HOTELS & CASINO RESORTS THIRD QUARTER RESULTS October 25, 1999 EBITDA INCREASED TO $106.7 MILLION VS. $90.6 MILLION IN 1998 NET PROFIT INCREASED TO 63 CENTS PER SHARE VS. 24 CENTS PER SHARE IN 1998 Net income increased to $14.0 million or $0.63 per share, before a one-time Trump World s Fair charge, compared to $5.3 million or $0.24 per share in 1998. 7
QUALITY SPECTRUM OF FINANCIAL REPORTS EBITDA INCREASED TO $106.7 MILLION VS. $90.6 MILLION IN 1998 NET PROFIT INCREASED TO 63 CENTS PER SHARE VS. 24 CENTS PER SHARE IN 1998 Net income increased to $14.0 million or $0.63 per share, before a one-time Trump World s Fair charge, compared to $5.3 million or $0.24 per share in 1998. The problem? EBITDA of $106.7 excluded a one- time charge but included a one-time gain. GAAP Net Income not shown in this excerpt was $67.5 million loss, not a $14 million profit. 8
QUALITY SPECTRUM OF FINANCIAL REPORTS Earnings Management: Deliberate actions to influence reported earnings - Real Earnings Management, for example: Defer R&D expenses into the next quarter in order to meet earnings targets. - Accounting Earnings Management, for example: Change accounting estimates in order to meet earnings targets. 9
QUALITY SPECTRUM OF FINANCIAL REPORTS Non-Compliant Accounting Enron (2001) used special purpose entities to understate debt and overstate profits and cash flow WorldCom (2002) capitalized certain expenditures to understate expenses and thus overstate earnings and operating cash flow New Century Financial (2007) reserved minimal amounts for loan repurchase losses for subprime mortgages. 10
QUALITY SPECTRUM OF FINANCIAL REPORTS Fictitious Transactions Equity Funding Corp. (1970s) created fictitious revenues and even fictitious policy holders. Crazy Eddie s (1980s) reported fictitious inventory as well as fictitious revenues supported by fake invoices. Parmalat (2004) reported fictitious bank balances. 11
MOTIVATIONS POTENTIALLY ASSOCIATED WITH LOW FINANCIAL REPORTING QUALITY Mask poor performance (e.g., declining profitability or lower profitability than competitors) Meet or beat market expectations (e.g., analysts forecasts and/or management s guidance) - Increase stock price, if only temporarily - Increase credibility with market participants Increase compensation that is linked to reported earnings Avoid violation of debt covenants 12
CONDITIONS CONDUCIVE TO ISSUING LOW- QUALITY FINANCIAL REPORTS Opportunity Rationalization Motivation 13
MECHANISMS THAT DISCIPLINE FINANCIAL REPORTING QUALITY Regulatory Authority Auditors Private Contracting 14
MECHANISMS THAT DISCIPLINE FINANCIAL REPORTING QUALITY Regulatory Authority Auditors Private Contracting 15
MECHANISMS THAT DISCIPLINE FINANCIAL REPORTING QUALITY Regulatory Authority Auditors Private Contracting 16
MECHANISMS THAT DISCIPLINE FINANCIAL REPORTING QUALITY POTENTIAL LIMITATIONS Regulatory Authority Auditors Private Contracting 17
COMPANIES PRESENTATION CHOICES What information to present beyond required disclosures? - Operating metrics ( eyeballs, clicks, users) - Pro forma measures (a.k.a. Non-GAAP or non-IFRS measures) How to present the information? - Emphasize the positive aspects of performance - Include boilerplate and excessive or irrelevant detail 18
PRESENTATION CHOICES: GROUPON S NON-GAAP METRIC Originally Shown (June S-1 filing) AfterSEC s Review (November S-1 filing) 19
ACCOUNTING CHOICES Choices exist among accounting methods and estimates, including the following: Revenue recognition - Timing - Amounts Expense recognition - Inventory cost flow - Capitalizing versus expensing - Depreciation method and estimates - Allowances for realization of assets 20
ACCOUNTING CHOICES: INVENTORY COST FLOW ASSUMPTIONS Trade-offs exist, and investors should be aware of how accounting choices affect financial reports. FIFO (first-in-first-out) cost assumption: - More current costs are included in ending inventory on the balance sheet. - Older costs are included in cost of sales on the income statement. Weighted-average cost assumption: - A blend of old and new costs in inventory on the balance sheet not as current as with FIFO. - A blend of old and new costs in cost of sales on the income statement more current than with FIFO. 21
ACCOUNTING CHOICES: INVENTORY COST FLOW ASSUMPTIONS Units 5 5 5 5 5 Cost per Unit Total Cost Purchase 1 Purchase 2 Purchase 3 Purchase 4 Purchase 5 Cost of goods available for sale $100 150 180 200 240 $500 750 900 1,000 1,200 $4,350 A company starts operations with no inventory at the beginning of a fiscal year and makes five purchases of goods for resale, as shown in the table. During the period, the company sells all of the goods purchased except for five units. What are the ending inventory and cost of goods sold if the company uses the FIFO method of inventory costing? 22
ACCOUNTING CHOICES: INVENTORY COST FLOW ASSUMPTIONS Units 5 5 5 5 5 Cost per Unit Total Cost First costs in are first costs out to cost of goods sold: $3,150 Purchase 1 Purchase 2 Purchase 3 Purchase 4 Purchase 5 Cost of goods available for sale $100 150 180 200 240 $500 750 900 1,000 1,200 $4,350 Last in are in ending inventory $1,200 A company starts operations with no inventory at the beginning of a fiscal year and makes five purchases of goods for resale, as shown in the table. During the period, the company sells all of the goods purchased except for five units. What are the ending inventory and cost of goods sold if the company uses the FIFO method of inventory costing? 23
ACCOUNTING CHOICES: INVENTORY COST FLOW ASSUMPTIONS Units 5 5 5 5 5 Cost per Unit Total Cost First costs in are first costs out to cost of goods sold: $3,150 Purchase 1 Purchase 2 Purchase 3 Purchase 4 Purchase 5 Cost of goods available for sale $100 150 180 200 240 $500 750 900 1,000 1,200 $4,350 Last in are in ending inventory: $1,200 A company starts operations with no inventory at the beginning of a fiscal year and makes five purchases of goods for resale, as shown in the table. During the period, the company sells all of the goods purchased except for five units. What are the ending inventory and cost of goods sold if the company uses the FIFO method of inventory costing? 24
ACCOUNTING CHOICES: INVENTORY COST FLOW ASSUMPTIONS Units 5 5 5 5 5 Cost per Unit Total Cost Purchase 1 Purchase 2 Purchase 3 Purchase 4 Purchase 5 Cost of goods available for sale $100 150 180 200 240 $500 750 900 1,000 1,200 $4,350 A company starts operations with no inventory at the beginning of a fiscal year and makes five purchases of goods for resale, as shown in the table. During the period, the company sells all of the goods purchased except for five units. What are the ending inventory and cost of goods sold if the company uses the weighted-average method of inventory costing? 25
ACCOUNTING CHOICES: INVENTORY COST FLOW ASSUMPTIONS Units 5 5 5 5 5 25 Cost per Unit Total Cost Average cost per unit = $4,350/25 units = $174 Purchase 1 Purchase 2 Purchase 3 Purchase 4 Purchase 5 $100 150 180 200 240 $500 750 900 1,000 1,200 Ending inventory = 5 $174 = $870 Cost of goods available for sale $4,350 A company starts operations with no inventory at the beginning of a fiscal year and makes five purchases of goods for resale, as shown in the table. During the period, the company sells all of the goods purchased except for five units. Cost of goods sold = 20 $174 = $3,480 What are the ending inventory and cost of goods sold if the company uses the weighted-average method of inventory costing? 26
ACCOUNTING CHOICES: INVENTORY COST FLOW ASSUMPTIONS 27
ACCOUNTING CHOICES: CAPITALIZING VS. EXPENSING AN EXPENDITURE Capitalizing versus expensing affects cash flows as well as earnings and the balance sheet. Assume a company incurs total interest cost of $30,000, composed of $3,000 discount amortization and $27,000 interest payments. Of the total, $20,000 is expensed and the remaining $10,000 is capitalized as plant assets. The following cash flow classification alternatives for the $27,000 exist: Use the same interest expense/capitalization proportions to allocate the interest payments between operating and investing activities Operating $18,000 I. Investing $9,000 Offset the entire $3,000 of non-cash discount amortization against the $20,000 treated as expense and included in operating cash flow Operating $17,000 II. Investing $10,000 Offset the entire $3,000 of non-cash discount amortization against the $10,000 capitalized and included in financing cash flow Operating $20,000 III. Investing $7,000 28
ACCOUNTING CHOICES: CASH FLOW CLASSIFICATION Presentation choices permitted in IAS 7, Statement of Cash Flows, offer flexibility in classification of certain items on the cash flow statement that is not available under US GAAP. This flexibility can significantly change the results in the operating section of the cash flow statement. IAS 7, Paragraphs 33: Interest paid and interest and dividends received are usually classified as operating cash flows for a financial institution. However, there is no consensus on the classification of these cash flows for other entities. Interest paid and interest and dividends received may be classified as operating cash flows because they enter into the determination of profit or loss. Alternatively, interest paid and interest and dividends received may be classified as financing cash flows and investing cash flows respectively, because they are costs of obtaining financial resources or returns on investments. [Emphasis added.] IAS 7, Paragraph 34: Dividends paid may be classified as a financing cash flow because they are a cost of obtaining financial resources. Alternatively, dividends paid may be classified as a component of cash flows from operating activities in order to assist users to determine the ability of an entity to pay dividends out of operating cash flows. [Emphasis added.] 29
SUMMARY OF ANALYSTS CONSIDERATIONS: REVENUE RECOGNITION Timing of revenue recognition Multiple deliverables Allowances for sales returns Days sales outstanding Rebates 30
ANALYTICAL PROCEDURES TO DETECT WARNING SIGNS: REVENUE RECOGNITION Examine the accounting policies note for a company s revenue recognition policies. Consider whether the policies make it easier to prematurely recognize revenue - Recognizing revenue immediately upon shipment of goods - Bill-and-hold arrangements Consider estimates and judgments required by the policies - Barter transactions can be difficult to value properly - Rebate programs involve many estimates - Multiple-deliverable arrangements require allocation of revenue and timing of revenue recognition for each item or service 31
ANALYTICAL PROCEDURES TO DETECT WARNING SIGNS: REVENUE RECOGNITION (CONTINUED) Look at revenue relationships. Compare a company s revenue growth with its primary competitors or its industry peer group and understand the reasons for major differences - Superior management or products and services? - Revenue quality? Compare accounts receivable with revenues - Examine the trend in receivables as a percentage of total revenues. - Examine the trend in receivables turnover for unusual changes and seek an explanation if they exist. - Compare a company s days sales outstanding (DSO) or receivables turnover with that of relevant competitors or an industry peer group. Examine asset turnover 32
SUMMARY OF ANALYSTS CONSIDERATIONS: INVENTORY METHODS Method compared with competitors Reserves for obsolescence LIFO liquidation 33
ANALYTICAL PROCEDURES TO DETECT WARNING SIGNS: INVENTORY Look at inventory relationships. Compare a company s inventory growth relative to sales growth with its primary competitors or its industry peer group and understand the reasons for major differences Examine trend in inventory turnover - Poor inventory management? - Obsolescence? Future write-offs? - Overstated current gross and net profits? If company uses LIFO (allowed under US GAAP), note whether LIFO liquidations occurred 34
SUMMARY OF ANALYSTS CONSIDERATIONS: LONG-LIVED ASSETS Estimated life spans compared with others in the same industry Changes in depreciable lives Asset write-downs Policies compared with competitors Capitalization 35
ANALYTICAL PROCEDURES TO DETECT WARNING SIGNS: LONG-LIVED ASSETS Examine the company s accounting policy note for its capitalization policy for long-term assets, including interest costs, and for its handling of other deferred costs. Compare the company s policy with industry practice. If the company s policy is an outlier, cross-check asset turnover and profitability margins with others in the industry. 36
ANALYTICAL PROCEDURES TO DETECT WARNING SIGNS: OPERATING CASH FLOW VS. NET INCOME Pay attention to the relationship of cash flow and net income. If net income is consistently higher than operating cash flow, it can signal accrual accounting policies that shift revenue to current period and/or current expenses to later periods. Construct a time series of cash generated by operations divided by net income. If the ratio is consistently below 1.0 or has declined repeatedly, there may be problems in the company s accrual accounts. 37
ALLOWANCE FOR BAD DEBT . . . Generally, UAP s policy required that accounts which were past due between 90 days and one year should be reserved at 50%, and accounts over one year past due were to be reserved at 100%. . . . In FY 1999 and continuing through FY 2000, UAP had substantial bad debt problems. In FY 2000, certain former UAP senior executives were informed that UAP needed to record an additional $50 million of bad debt expense. . . .just prior to the end of UAP s FY 2000, the former UAP COO (chief operating officer), in the presence of other UAP employees, ordered that UAP s bad debt reserve be reduced by $7 million in order to assist the Company in meeting its PBT target for the fiscal year. . . At the end of FY 2000, former UAP senior executives reported financial results to ConAgra which they knew, or were reckless in not knowing, overstated UAP s income before income taxes because UAP had failed to record sufficient bad debt expense. SEC Accounting and Auditing Enforcement Release 38
VALUATION RESERVE FOR DEFERRED TAX ASSETS PowerLinx improperly recorded on its fiscal year 2000 balance sheet a deferred tax asset of $1,439,322 without any valuation allowance. The tax asset was material, representing almost forty percent of PowerLinx s total assets of $3,841,944. PowerLinx also recorded deferred tax assets of $180,613, $72,907, and $44,921, respectively, in its financial statements for the first three quarters of 2000. PowerLinx did not have a proper basis for recording the deferred tax assets. The company had accumulated significant losses in 2000 and had no historical operating basis from which to conclude that it would be profitable in future years. Underwater camera sales had declined significantly and the company had devoted most of its resources to developing its SecureView product. The sole basis for PowerLinx s expectation of future profitability was the purported $9 million backlog of SecureView orders, which management assumed would generate taxable income; however, this purported backlog. . . did not reflect actual demand for SecureView cameras and, consequently, was not a reasonable or reliable indicator of future profitability. SEC Accounting and Auditing Enforcement Release 39
ANALYTICAL PROCEDURES TO DETECT WARNING SIGNS: ALLOWANCES Examine allowances for which estimates can impact earnings, for example: Accounts Receivable Allowance for Doubtful Accounts - Examine changes in allowances as a percentage of the asset account. - Collection experience. Tax Asset Valuation Accounts - Assess reasonableness of level. - Examine changes in the valuation account. - Compare allowance level with information in the management commentary. - Compare allowance level with information in the tax note. 40
OTHER POTENTIAL WARNING SIGNS: AREAS THAT MIGHT SUGGEST FURTHER ANALYSIS Depreciation methods and useful lives compared with those of its peers Fourth-quarter surprises routinely occurring Presence of related-party transactions Non-operating income or one-time sales included in revenue Classification of expenses as non-recurring Gross/operating margins out of line with competitors or industry, an ambivalent signal. 41
IMPORTANCE OF CONTEXT IN JUDGING WARNING SIGNS Companies with an unblemished record of meeting growth projections (especially younger companies) Minimalist approach to disclosure for example, highly aggregated segment reporting Fixation on reported earnings for example, the use of aggressive non-GAAP metrics or frequent special items Restructuring and/or impairment charges Merger and acquisition activity, including allocation of purchase price in an acquisition 42
SUMMARY Financial reporting quality can be thought of as spanning a continuum. Reporting quality pertains to the information disclosed whereas results quality (commonly referred to as earnings quality) pertains to the earnings and cash generated by the company s actual economic activities. Motivations to issue lower-quality financial reports include masking poor performance, boosting the stock price, increasing personal compensation, and/or avoiding violation of debt covenants. Mechanisms that discipline financial reporting quality include the free market and incentives for companies to minimize cost of capital, auditors, contract provisions, and enforcement by regulatory entities. Examples of accounting choices that affect earnings and balance sheets include revenue recognition, inventory cost flow assumptions, estimates of realizability of assets (such as accounts receivable and deferred tax assets), depreciation method, estimated salvage value, and useful life of depreciable assets. Warning signals of potential accounting manipulation should be evaluated cohesively, not on an isolated basis. 43