Financial Results for Nine Months Ended December 2018 - Revenue, EBITDA, PAT, and Projects
Explore the financial results for the nine months ended December 2018, including revenue breakdown, EBITDA, PAT margins, top projects based on turnover contribution, and segment-wise order book details. See the growth in operating revenue, total revenue, core EBITDA, and PAT percentages.
Download Presentation

Please find below an Image/Link to download the presentation.
The content on the website is provided AS IS for your information and personal use only. It may not be sold, licensed, or shared on other websites without obtaining consent from the author. If you encounter any issues during the download, it is possible that the publisher has removed the file from their server.
You are allowed to download the files provided on this website for personal or commercial use, subject to the condition that they are used lawfully. All files are the property of their respective owners.
The content on the website is provided AS IS for your information and personal use only. It may not be sold, licensed, or shared on other websites without obtaining consent from the author.
E N D
Presentation Transcript
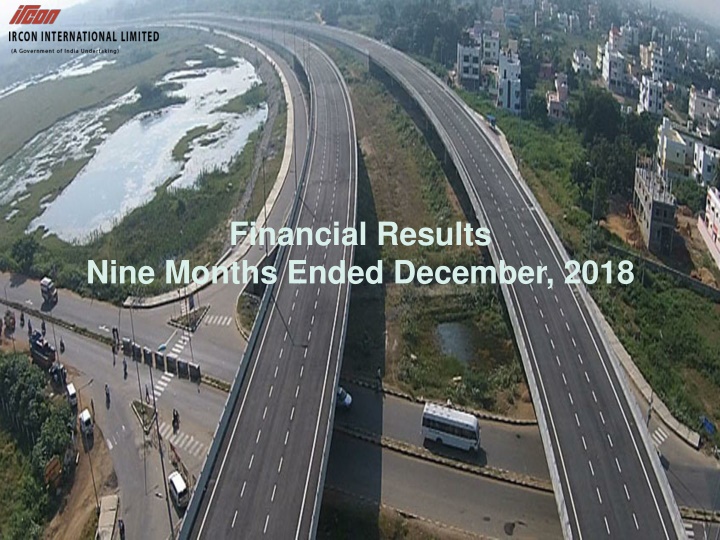
Financial Results Nine Months Ended December, 2018
Revenue (Standalone) 9 months Operating Revenue Total Revenue 2882.31 4000.00 3000 2393.49 3073.22 2547.69 3000.00 2000 2000.00 1000 1000.00 0 0.00 9M ended FY18 9M ended FY18 9M ended FY19 9M ended FY19 Operating Revenue Total Revenue - Operating Revenue increased by 20.42% over corresponding nine months ended FY18. - Operational revenue contributed by Railways is 84% - Operational revenue contributed by Highways is 12%
Core EBITDA & PAT (Standalone) 9 months 11.36% 349.09 15.00% 400 7.65% 220.58 300 6.73% 10.00% 171.55 6.08% 200 145.46 5.00% 9M ended FY19 100 9M ended FY19 9M ended FY18 0.00% 9M ended FY18 0 PAT Margin Core EBITDA Margin PAT Core EBITDA 9M ended FY18 9M ended FY19 9M ended FY18 9M ended FY19 - Core EBITDA margin increased to 7.65% from 6.08% over corresponding period FY18. - PAT margin increased to 11.36% from 6.73% over corresponding period FY18.
Financial Summary 9 months (Rs. in Crore) For Nine months Increase/ (Decrease) (%) Particulars 2018-19 2017-18 Operating Revenue 2882 2393 20.42% Total Revenue 3073 2548 20.63% Core EBITDA 221 145 52.41% Core EBITDA Margin (%) 7.65 6.08 1.57% PBT 392 238 64.70% PAT 349 172 102.91% PAT Margin (%) 11.36 6.73 4.63% EPS (In Rupees) 37.12 17.35 - - Above figures are on standalone basis. Statutory Auditor has carried out limited review of financials for nine months ended December 2018.
Revenue (Standalone) For Q3 Operating Revenue Total Revenue 1500 1500 1255.65 1215.89 963.77 908.59 1000 1000 500 500 0 0 Q3 FY18 Q3 FY18 Q3 FY19 Q3 FY19 Operating Revenue Total Revenue - Operating Revenue increased by 33.82% over corresponding quarter of FY18.
Top Five Projects based on Turnover Contribution in FY 2018-19 Rs. in Crore Name of the Project Revised Contrac t Value Actual T.O. upto 31.3.18 Turnove r Target for 2018- 19 Turnover Target upto Dec. 2018 T.O . Achieved in FY 2018-19 (Upto Dec 18) Cumulativ e T.O. upto 31.12.2018 Balance Work Load beyond 31.03.20 18 J & K RAIL PROJECT KATRA- QAZIGUND SECTION CHATTISGARH- CERL Const. 12287.56 5248.46 5954.69 6171.89 1000.00 772.09 706.23 1743.13 489.90 731.15 1011.98 340.00 199.00 241.25 HAJIPUR BACHWARA 584.00 73.80 220.14 363.86 250.00 133.00 146.34 KHULNA MONGLA 911.16 121.66 242.36 668.80 250.00 150.91 120.70 DAVANAGERE HAVERI HIGHWAY 916.93 - 119.27 797.66 360.00 223.69 119.27
Order Book as on 31.12.2018 Segment wise Order Book (Rs. in Crore) Sl. Segment Amount 1. Railway 23,134 2. Electrical 416 3. Buildings 229 4. Road & Highways 2,307 Total 26,086


