Financial Statement Analysis - Growth Inc. Acquisition Overview
Dive into the financial statements of Growth Inc. to assess its performance for potential acquisition. Analyze revenues, expenses, income, and balance sheet details to make informed decisions. Explore practical exercises and exercises in financial statement analysis.

Download Presentation

Please find below an Image/Link to download the presentation.
The content on the website is provided AS IS for your information and personal use only. It may not be sold, licensed, or shared on other websites without obtaining consent from the author.If you encounter any issues during the download, it is possible that the publisher has removed the file from their server.
You are allowed to download the files provided on this website for personal or commercial use, subject to the condition that they are used lawfully. All files are the property of their respective owners.
The content on the website is provided AS IS for your information and personal use only. It may not be sold, licensed, or shared on other websites without obtaining consent from the author.
E N D
Presentation Transcript
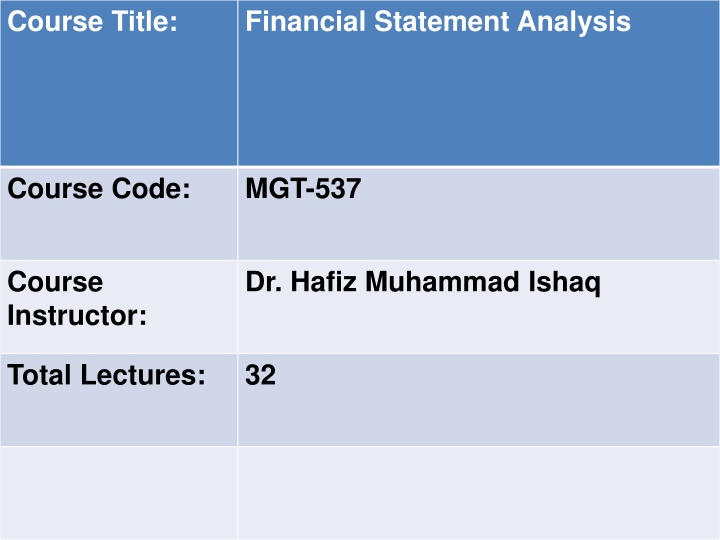
Course Title: Financial Statement Analysis Course Code: MGT-537 Course Instructor: Dr. Hafiz Muhammad Ishaq Total Lectures: 32
Previous Lecture Summary Expanded Analysis Perceptions of Financial Ratios Financial Ratios in Annual Reports Conservatism and Quality of Earnings Forecasting Financial Failure Univariate [Beaver] Model Multivariate [Altman] Model Management s Use of Analysis Use of LIFO Reserves Management of Earnings Valuation What Analysts Use Practical Exercises
Today's Lecture Topics Expanded Analysis Practical Exercises
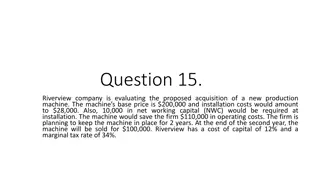
Practical Exercise Your company is considering the possible acquisition of Growth Inc. Financial statements of Growth Inc. follow: Growth Inc. Statement of Income Years Ended December 31, 1998, 1997, and 1996 1998 Revenues $578,530 $523,249 $556,549 Cost and expenses: Cost of products sold 495,651 457,527 482,358 Selling, general, and administrative 35,433 30,619 29,582 Interest and debt expense 4,308 535,392 1996 1997 3,951 492,097 514,570 2,630
Practical Exercise (Contd) Income before income taxes Provision for income taxes Net income Net income per share 43,138 20,120 $23,018 $2.27 31,152 12,680 $18,472 $1.85 41,979 17,400 $24,579 $2.43
Practical Exercise (Contd) Growth Inc. Balance Sheet Years Ended December 31, 1998, 1997 Assets Current Assets Cash Account Receivable less allowance Of$750 for doubtful accounts Inventories FIFO Prepaid expenses Total current assets Investments and other assets $1998 $1997 $64,346 $99,021 $63,414 834 227,615 379 175 $11,964 $83,575 $74,890 1,120 171,599
Practical Exercise (Contd) Property, plant and equipment: Land and land improvements Buildings Machinery and equipment Less: Accumulated depreciation Net property, plant and equipment Total assets 6,990 6,400 63,280 59,259 182,000 156,000 252,270 221,659 110,000 98,000 142,270 123,659
Practical Exercise (Contd) Liabilities and Stockholders Equity Current Liabilities: Accounts payable Federal income taxes Accrued liabilities Current portion of long term debt Total current liabilities Long-term debt Other long term liabilities Deferred federal income taxes Total liabilities $32,730 26,850 5,300 4,800 30,200 24,500 5,500 5,500 $73,730 $61,650 76,750 41,900 5,700 4,300 16,000 12,000 $172,180 $119,850
Practical Exercise (Contd) Stockholder equity: Capital stock Retained earnings Total stockholder s equity Total liabilities and stockholder s equity Partial footnotes Under the FIFO method, inventories have been reduced by approximately $35,300 and $41,100 at December 31,1998 and 1997, respectively, from current cost, which be reported under the first in first out method. The effective tax rates were 36.6%,30.7% and 31.4% respectively for the years ended December 31,1998,1997 and 1996. 44,000 154,084 132,083 198,084 175,583 $370,264 43500 $295,433
Practical Exercise (Contd) Required: Compute the following for 1998 without considering the LIFO reserve: Liquidity Days sales in inventory Merchandise inventory turnover Inventory turnover in days Operating cycle Working capital Current ratio Acid test ratio Cash ratio Debt Debt ratio
Practical Exercises (Contd) Debt/equity ratio Times interest earned Profitability Net profit margin Total assets turnover Return on assets Return on total equity Compute the ratios in part (a) considering the LIFO reserve Comment on the apparent liquidity, debt, and profitability, considering both sets of ratios.
All but one liquidity ratio was less favourable when considering the LIFO reserve. Some of the liquidity ratios declined substantially. The only liquidity indicator to improve was working capital. Debt ratios were slightly more favourable when considering the LIFO reserve. Profitability declined moderately when the LIFO reserve was considered.
Lecture Summary Expanded Analysis Practical Exercises


")
")
")
")
")
")
")
")
")
")
")
")
")
")
")
")
")
")