Financial Statements Analysis 2025 Insights
Explore the financial performance of Al Anwar Investments SAOG for the year ended on March 31, 2025. Dive into the investment portfolio, portfolio allocation, and performance of associate companies with revenue and net profit data. Gain valuable insights into the company's operations and market positioning.
Download Presentation

Please find below an Image/Link to download the presentation.
The content on the website is provided AS IS for your information and personal use only. It may not be sold, licensed, or shared on other websites without obtaining consent from the author. If you encounter any issues during the download, it is possible that the publisher has removed the file from their server.
You are allowed to download the files provided on this website for personal or commercial use, subject to the condition that they are used lawfully. All files are the property of their respective owners.
The content on the website is provided AS IS for your information and personal use only. It may not be sold, licensed, or shared on other websites without obtaining consent from the author.
E N D
Presentation Transcript
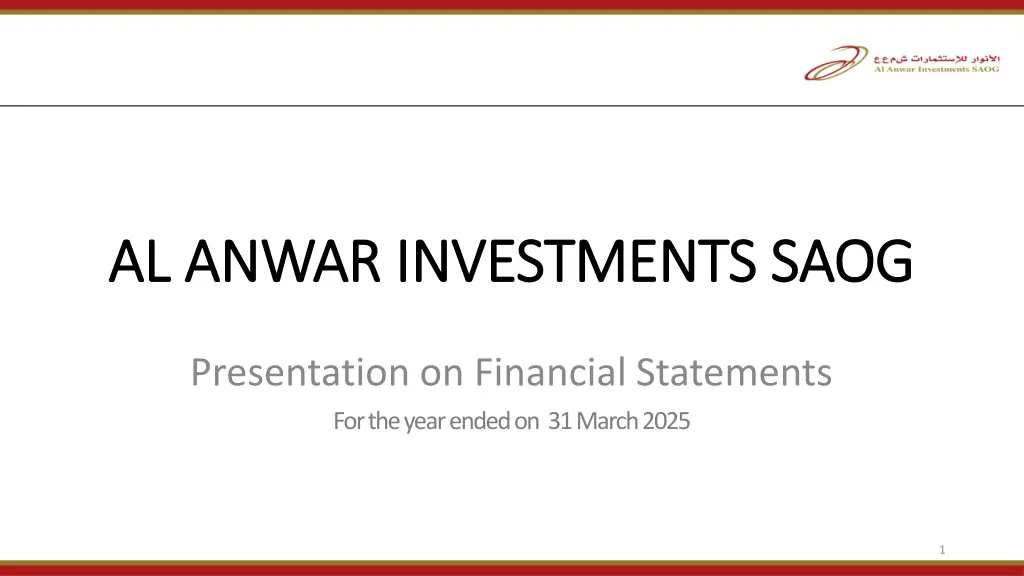
AL ANWAR INVESTMENTS SAOG AL ANWAR INVESTMENTS SAOG Presentation on Financial Statements For the year ended on 31 March 2025 1
Investment Portfolio Carrying Value (OMR k) CYFR Fund 0% Land 3% Others (Recv + Cash) 4% S. No. Name of Company A. Associate - Group Carrying Value A-1 Oman Chlorine SAOG A-2 National Detergent SAOG A-3 Arabia Falcon Insurance SAOG A-4 Alruwad School SAOC A-5 Voltamp Energy SAOG A-6 National Biscuit SAOG A-7 Al Maha Ceramics SAOG Investment at Fair Value- Group Carrying Value B-1 NBO B-2 DIDIC B-3 Bank Dhofar SAOG B-4 Others C. Real Estate D. Receivable and other assets Total % Stake % of CV 29,392 7,989 5,423 5,192 3,464 2,894 2,600 1,830 44.3% 12.0% 8.2% 7.8% 5.2% 4.4% 3.9% 2.8% 22.11% 25.24% 22.62% 43.51% 15.00% 29.22% 18.74% Alritaz 0% Oman Chlorine 12% CSI 0% Bank Dhofar 10% National Detergent 8% Arabia Falcon 8% DIDIC 10% B. 32,352 18,927 6,764 6,490 171 2,284 2,351 66,379 48.7% 28.5% 10.2% 9.8% 0.3% 3.4% 3.5% 100% 4.01% 5.68% 1.51% Alruwad School 5% Voltamp 4% NABIL 4% NBO 29% Al Maha 3% 2
Portfolio Allocation MAR-25 (OMR 66.4MN) MAR-24 (OMR 47.8MN) Others (Recv+ Cash) 3% Others (Recv+ Cash) 4% Property 5% Property 3% Education 5% Education 11% Industrial 31% Insurance 8% Industrial 43% Insurance 10% Financial 11% Financial 13% Banking 15% Banking 38% 3
Performance of Associate Companies Revenue (OMR 000) Net Profit (OMR'000) 6,000 45,000 40,000 5,000 35,000 4,000 30,000 3,000 25,000 2,000 20,000 1,000 15,000 0 10,000 -1,000 5,000 0 -2,000 Oman Chlorine SAOG National Detergent SAOG Arabia Falcon Insur. SAOG Voltamp Energy SAOG National Biscuit SAOG Al Maha Ceramics SAOG Oman Chlorine SAOG National Detergent SAOG Al Maha Ceramics SAOG Alruwad School SAOC Arabia Falcon Insur. SAOG Alruwad School SAOC Voltamp Energy SAOG National Biscuit SAOG Dec-23 Dec-23 32,174 21,181 20,974 2,380 30,513 16,453 5,707 1,968 658 742 -738 817 601 -1,121 Dec-24 Dec-24 34,424 24,519 21,762 2,360 41,553 19,459 4,929 1,530 1,394 1,585 -603 5,281 993 -1,465 Share of Profit (OMR 000) Management Comments All our Associate Companies (Except Alruwad school) are listed companies. Investor and financial analyst can obtain more detail from MSX. All of our associate companies (Except Al Maha and Alruwad School) reported better revenue than last year. Despite of increase in sales, Oman Chlorine profitability has been lower than last year mainly on account of decline of caustic prices globally. Voltamp, National detergent and National Biscuit (NABIL) recorded all time high revenue and net profit. Arabia Falcon performed well with the higher revenue and profit as compared to last year. Alruwad School has reported lower revenue, but its losses reduced versus compared to last year. The revenue declined primarily due to lower number of students enrolled in the school during academic year. As a result, Alruwad has taken several steps to reduces losses. Al Maha has recorded lower revenue and higher loss during the year. AMC has written off its entire investment in Al Hael Ceramics. Oman Govt. has imposed antidumping duty on all ceramic and Porcelain products coming from India and China, which should have positive impact on Al Maha Performance 2000 1500 1000 500 0 -500 Arabia Falcon Insur. SAOG Oman Chlorine SAOG National Detergent SAOG Alruwad School SAOC Voltamp Energy SAOG National Biscuit SAOG Al Maha Ceramics SAOG Total Dec-23 435 166 163 -321 150 176 -210 559 Dec-24 338 352 359 -262 1,086 290 -274 1889 4
Company Performance Mar25 Expenses (OMR'000) Income (OMR 000) 1,888 1,400 1,264 2,000 1,358 1,200 1,066 1,500 911 1,000 1,000 640 622 559 480 465 800 500 31 28 16 520 500 498 600 - 400 (157) (500) 76 200 Share of profit from associates Realised Profit / (loss) on sale of investment in associates Realised/(Loss) on Sale of FV investments FV Gain/ (Loss) on investments Interest/ Dividend Income Other Income - Finance Cost Admin Expenses Other Expenses Mar-24 Mar-25 Mar-24 Mar-25 Net Profit & Other Comp. Income (OMR 000) Performance Overview The company reported a net profit of OMR 2,385k for the year ended on 31 March 2025, 348% improvement from last year. The total comprehensive income was OMR 1,657k, 6% higher than last year. Share of Profit (SoP) from Associate companies for the year is OMR 1,888k, which is 238% higher than OMR 559k of 2023-24. This is mainly on account of excellent performance of all associates except Al Maha and Alruwad School. Impairment of OMR 540k recorded on Alruwad school during the year. Recorded realised gain of OMR 1,358k on the sell of 9.68% stake in Voltamp. As a result of increase in borrowing from OMR 15.8mn to OMR 28.8mn at the end of current year, finance cost increased from OMR 1,066k to OMR 1,264k. Debt/ Equity ratio increased to 0.77 times from 0.49 times of last year. Average rate of interest reduced to 6.27% from last year s 6.34%. 3,000 2,385 2,500 2,000 1,657 1,568 1,500 1,000 532 500 - Net Profit/ (Loss) Total Other Comprehensive Income Mar-24 Mar-25 5
FINANCIAL OVERVIEW BALANCE SHEET Particulars Assets Investment in Associates Investments at fair value Property & other assets Receivables and prepayments Cash and Bank Balance Total Assets 31-Mar-25 31-Mar-24 29,392 32,352 2,284 1,866 485 66,379 30,915 13,241 2,274 1,263 85 47,778 Equity Share Capital Legal Reserve Fair Value reserve Retained Earnings Total Equity 26,086 4,930 1,646 4,756 37,418 20,600 4,674 2188 4,412 31,874 Liabilities Bank Borrowings Payables Total Liabilities Total equity and liabilities Net assets per share (in Baiza) 28,790 171 28,961 66,379 0.130 15,725 179 15,904 47,778 0.155 6
Annexure 4- Bank Borrowing 31-Mar-24 31-Mar-25 Debt Equity Ratio Particulars (OMR 000) Audited Actual 37,418 40,000 1.00 Actual outstanding 15,725 28,790 31,874 31,306 28,790 0.80 0.77 30,000 Average Outstanding 16,821 20,146 0.60 17,142 0.55 15,725 Interest cost 1,066 1,264 20,000 0.49 0.40 Range of Interest Rates 5.50% - 6.50% 5.75% - 6.50% 10,000 0.20 Effective rate of Interest 6.34% 6.27% - - Mar'23 Mar'24 Mar'25 Total Debt Total Equity D / E Ratio Strictly Private and Confidential 7











![Innovative Solutions for Investor Success - [Your Name] & [Your Company Name]](/thumb/196869/innovative-solutions-for-investor-success-your-name-your-company-name.jpg)
