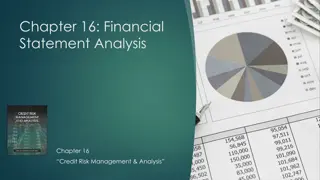
Explore the process of analyzing financial statements, including horizontal and vertical analysis, ratio analysis, and liquidity ratios. Learn how decision-makers use these techniques to make informed financial decisions in business.
Please find below an Image/Link to download the presentation.
The content on the website is provided AS IS for your information and personal use only. It may not be sold, licensed, or shared on other websites without obtaining consent from the author. If you encounter any issues during the download, it is possible that the publisher has removed the file from their server.
You are allowed to download the files provided on this website for personal or commercial use, subject to the condition that they are used lawfully. All files are the property of their respective owners.
The content on the website is provided AS IS for your information and personal use only. It may not be sold, licensed, or shared on other websites without obtaining consent from the author.
Horizontal ( or trend )Financial Analysis Also known as dynamic analysis the kind of analysis under which financial statements of a number of years of the firm are analyzed against o common base. This is also suitable for intra firm comparison.
Vertical Financial Analysis Is under which financial statements of firms of different size are compared and analyzed against a common base This is also suitable for inter firm comparison.
Ratio Analysis ` We use different techniques to evaluate it, and one very regular and common technique is financial ratios analysis Financialratiosanalysis. Generallyonlyratiois meantdividingonenumberby anothernumber. A financial ratios (or accounting ratios) is arelative magnitude of two selected numerical valuestaken from an Company s financialstatements. 7
These ratios are asunder: 1.LiquidityratiosorShorttermSolvencyratios 2. Debt management or Financial Leverageratios 3. EfficiencyorActivityorturnoverratios 4. Profitabilityratios 5. Market valueratios 8
1. LiquidityRatios: Liquidity ratios are the ratios that measure the ability of acompanytomeet itsonlyshorttermdebt. These ratios focus on current assets and current liabilities. Followingarethekeyratiosfall underthiscategory o CurrentRatio = CurrentAssets CurrentLiabilities oQuick Ratio= Current Assets Inventory PrepaidExpenses CurrentLiabilities 9
2. Debt managementor Financial Leverageratios Debt management or financial leverage ratios measure the ability of a company to meet it s over all financial obligations when they fall due. These ratios are asunder: o Total debt-to-Total Assetsratio = Total liabilities TotalAssets =Total equity TotalAssets Total Equity-to-Total assetsratio o = Earning before Interest &Taxes(EBIT) InterestExpenses Time InterestEarned o Long termdebt Total Capitalizationratio Long term debt to total capitalizationratio OR Gearing ratio = . *Where as, Total Capitalization = Long term debt +Total Equity 10
3. Efficiency or ActivityRatios: Theseratiosaretypicallyused inordertodetermine thathowquicklycertain assetsareconverted incashorsales. Similarly, italsoindicatesthat howquicklyaccounts payablearepaid. Following are the key ratios fall under thiscategory: o Accounts Receivables Turn overratio = NetCredit Sales AccountsReceivables o Period-in Days Average Collection = Days inayear Accounts Receivable TurnOver . Netsales o Total Assets Turn over ratio = . TotalAssets o AccountsPayables turn overratio = Net Creditpurchases . Accounts Payablesratio Continued on next page .. 11
o Average Payment period indays Days in ayear = . Accounts Payables TurnOver = o InventoryTurn Overratio Cost of goodsSold Inventory Days in ayear o AverageAgeof Inventoryindays = . Inventory TurnOver 12
4. ProfitabilityRatios: Profitability ratios focuson howwell a business is performing in termsof profit.Profitabilityratiosdescribethat howeffectively the firm is using itsAssets & control itsexpenses togeneratean acceptable rate ofreturn. Followingare the key ratios fall underthiscategory: o Gross profitMargin = Grossprofit NetSales o Operating ProfitMargin = Net Profit+interest NetSales o ProfitMargin = Net Profit NetSales . . Continued on nextpage . 13
= o ReturnonTotal Assets/investments NetIncome . Totalassets o Returnon CommonEquity = Net Income Preferred stockdividend CommonEquity = o Return on total Equity NetIncome TotalEquity 14
5. Market valueratios: Marketvalue ratiosevaluate theeconomicstatusof yourcompany in themarketplace. Following arethekeyratiosfallunderthiscategory: o EarningperShare = Net Income Preferred Stockdividend Common Stock outstanding (InNos) o Price Earningratio = Market price perShare Earning perShare Continued on next page. .. 15
= Total Stockholders Equity Preferredstock Common Stock outstanding (InNos) o Book value/Share o Dividend Yield = Dividend perShare . Market price perShare o Dividend payout =Dividend per common stock Share Earning per common stock Share[EPS] 16
Howtodrawafinal conclusionfromtheRatioanalysis: A meaningfulconclusionis needed finallyfromratioanalysis. Forexample: Isthisyeargoodorbad? Itis judged bythefollowing procedures: Trendanalysis - Itmeanscomparingallcurrentyear srelevantratios of the company with its own past years' ratios. Thus trend analysis determinesthefirm scurrentyearperformancewithpastyears. Comparingwithothersimilartypeof Industries-Market-It involvescomparingthefirm scurrentyear srelevantratioswithother similar type of Industries in themarket. Thusitdeterminesthefirm sperformancewithothercompetitor Benchmarking Itinvolvescomparingthefirm srelevantratioswith the world-classfirm Thusitdeterminesthefirm sperformancewiththeworldclassfirms. In this way the analyst is able to detect his final conclusion regarding the firm s improvement ordeclining during the current year/period throughabove. 17


Financial Analysis")