Financial Tables Demonstration for Excel-to-Word Automation
"Explore a detailed demonstration showcasing various financial tables automation using the Excel-to-Word Document Add-In. View examples of income statements, financial summaries, industry scenarios, cost-benefit analysis, and more."

Uploaded on | 1 Views
Download Presentation

Please find below an Image/Link to download the presentation.
The content on the website is provided AS IS for your information and personal use only. It may not be sold, licensed, or shared on other websites without obtaining consent from the author. If you encounter any issues during the download, it is possible that the publisher has removed the file from their server.
You are allowed to download the files provided on this website for personal or commercial use, subject to the condition that they are used lawfully. All files are the property of their respective owners.
The content on the website is provided AS IS for your information and personal use only. It may not be sold, licensed, or shared on other websites without obtaining consent from the author.
E N D
Presentation Transcript
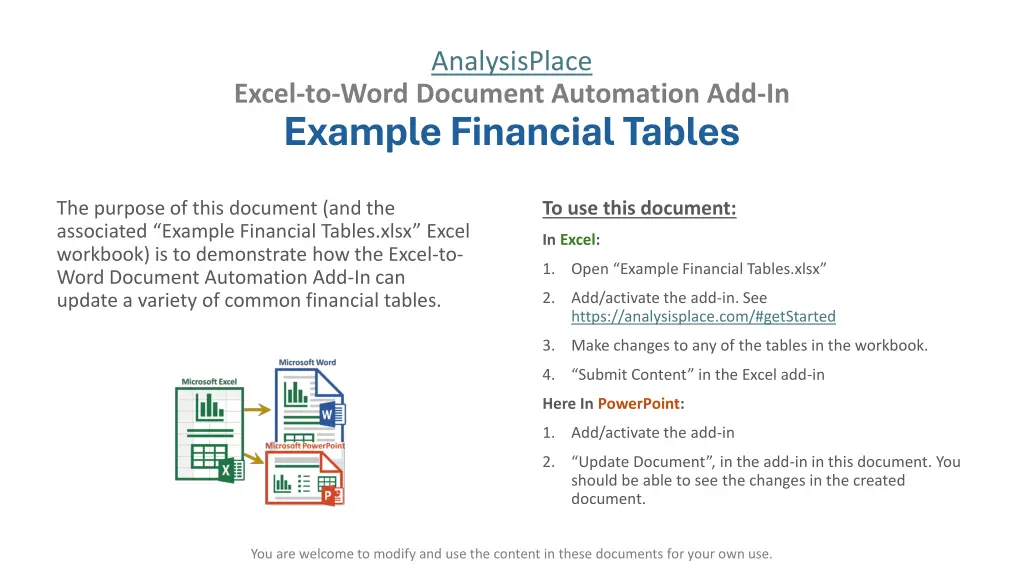
AnalysisPlace Excel-to-Word Document Automation Add-In Example Financial Tables The purpose of this document (and the associated Example Financial Tables.xlsx Excel workbook) is to demonstrate how the Excel-to- Word Document Automation Add-In can update a variety of common financial tables. To use this document: In Excel: 1. Open Example Financial Tables.xlsx 2. Add/activate the add-in. See https://analysisplace.com/#getStarted 3. Make changes to any of the tables in the workbook. 4. Submit Content in the Excel add-in Here In PowerPoint: 1. Add/activate the add-in 2. Update Document , in the add-in in this document. You should be able to see the changes in the created document. You are welcome to modify and use the content in these documents for your own use.
Contents Topic Description Financial Statements Income Statements 3 income statement examples with different table appearance settings. Basic Financials Summary financials by year Industry/Functional Examples Invoice Contains quantity/pricing table and various text inputs for dates, customer address, etc. Sales Reporting Several sales tracking/reporting tables and charts 3 tables from expandable data tables: inventory list and 2 expenses tables. Also demonstrates how filtered rows can either be shown or hidden in Word/PPT. Transactions and Lists TCO Comparison 4 tables analyzing TCO (Total Cost of Ownership) changes of a technology migration Cost-Benefit-ROI Analysis Several tables that assess costs, benefits, and ROI of an investment/initiative. Includes charts. Discounted Cash Flow Basic DCF calculations to value an entity How-To Examples PivotTables PivotTables can be transferred as Flex Tables, Destination Tables, or Images Demonstrates how to set up Auto-Hide. Automatically hides/unhides rows/columns based on cell value/formula when you click the "Auto-Hide Rows/Columns" button. Auto-Hide Rows/Columns Dashboards Sales Dashboard Image of a range that contains data, graphs, conditional content, sparklines, and images. HR Dashboard Image of a range contains data, graphs, and images.
Financial Statements - Income Income Statement Flex table. Properties are set to have white background, use PPT default font, and black text Income Statement Flex table. Appearance matches Excel. Column widths are set here in PPT. Income Statement 2025 2024 2025 2024 2023 US$000 current year prior year NET SALES Product Service TOTAL NET SALES Revenue Gross sales Less: sales returns Less: Discounts and Allowances Net Sales $1,000,000 $1,000,000 $2,000,000 $960,000 $950,000 $1,910,000 $921,600 $902,500 $1,824,100 $10,000 $385 $128 $9,487 $9,500 $365 $122 $9,013 COST OF SALES Product Service TOTAL COST OF SALES GROSS MARGIN Cost of Goods Sold Goods manufactured: Raw materials Goods manufactured: Direct Labor Overhead Total Cost of Goods Sold Gross Profit (Loss) $600,000 $600,000 $1,200,000 $800,000 $576,000 $570,000 $1,146,000 $764,000 $552,960 $541,500 $1,094,460 $729,640 $1,026 $1,154 $256 $2,436 $7,051 $974 $1,096 $244 $2,314 $6,699 OPERATING EXPENSES Research and Development Sales and Marketing General and Administrative Amortization of Purchased Intangible Assets In-Process Research and Development TOTAL OPERATING EXPENSES $160,000 $140,000 $120,000 $100,000 $80,000 $600,000 $152,800 $133,700 $114,600 $95,500 $76,400 $573,000 $145,928 $127,687 $109,446 $91,205 $72,964 $547,230 Operating Expenses Advertising Delivery/Freight Expense Depreciation Insurance Interest Mileage Office Supplies Rent/Lease Maintenance and Repairs Travel Utilities/Telephone Expenses Wages Other Expenses Total Operating Expenses Operating Profit (Loss) Interest Income Other Income Profit (Loss) Before Taxes Less: Tax Expense Net Profit (Loss) $1,282 $64 $13 $1,218 $61 $12 $6 $6 $641 $128 $128 $64 $192 $128 $1,026 $256 $13 $3,942 $3,109 $256 $128 $3,494 $513 $2,981 $609 $122 $122 $61 $183 $122 $974 $244 $12 $3,745 $2,954 $244 $122 $3,319 $487 $2,832 OPERATING INCOME Interest Income, Net Other Income, Net INTEREST AND OTHER INCOME, NET $80,000 $80,000 $160,000 $76,400 $76,400 $152,800 $72,964 $72,964 $145,928 INCOME BEFORE TAXES AND ACCOUNTING CHANGE Provision for Income Taxes INCOME BEFORE ACCOUNTING CHANGE Cumulative Effect of Accounting Change, Net of Tax NET INCOME $360,000 $343,800 $328,338 $90,000 $270,000 $85,950 $257,850 $82,085 $246,254 $40,000 -$38,200 $36,482 $310,000 $219,650 $282,736
Financial Statements Income Statement - 6 Month Comparison Flex table. Columns widths remain (they are set here in PPT). Six Months Ended June 30, 2024 Adjust- ments Six Months Ended June 30, 2023 Adjust- ments ($ in millions, except per share data) GAAP Reported % Non-GAAP Adjusted % GAAP Reported Non-GAAP Adjusted Chng Chng 31 % $20,070.8 31 % $15,272.1 Revenue $20,070.8 $15,272.1 12 % 37 % 3.3 (278.2) 278.2 $3,565.5 $16,505.3 82.2% 12 % 37 % 3.0 (252.2) 252.2 3,181.9 12,090.2 79.2% Cost of sales Gross margin % of total revenue 3,843.7 16,227.1 80.8% 3,434.1 11,838.0 77.5% pp pp Research and development Marketing, selling and administrative Acquired in-process research and development Asset impairment, restructuring, and other special charges Operating income 21 % 11 % 31 % NM 72 % $5,234.0 $4,069.5 $264.8 21 % 11 % 31 % NM 79 % 4,341.6 3,674.6 202.1 5,234.0 4,069.5 264.8 435.0 6,223.8 4,341.6 3,674.6 202.1 (435.0) 713.2 $- - - - $6,937.0 252.2 3,871.9 3,619.7 Interest, net Other income Other - net, income (expense) $(280.1) $233.9 $(46.2) (142.9) 218.3 75.4 (280.1) 109.6 (170.5) (142.9) 141.8 (1.1) 124.3 124.3 76.5 76.5 NM NM Income before income taxes 67 % 837.5 $6,890.8 75 % 328.7 3,947.3 6,053.3 3,618.6 65 % (0.2) 170.9 $1,014.3 14.7% 75 % 68.5 579.0 14.7% Income tax expense (benefit) Effective tax rate 843.4 13.9% 510.5 14.1% pp - pp 68 % 666.6 $5,876.5 74 % 260.2 $3,368.3 Net income (loss) $5,209.9 $3,108.1 67 % 0.74 6.5 74 % 0.29 3.73 Earnings per share $5.76 $3.44 Diluted shares outstanding (thousands) - % 904,025 - % 902,991 904,025 902,991
Financial Statements - Income Basic Financials Flex Table Income Statement Destination-formatted Flex table. Font Size (and table column widths) scaled up 50% (to 150%). Cell Margins were added to improve appearance. Very different appearance than in Excel. Only the text is updated, not the formatting. Percent of Total 5/2/2025 % of Revenue Year 1 Year 2 Year 3 Total Revenue $800,000,000 100% Income Cost of Revenue $440,000,000 55% Users 50,000 400,000 1,600,000 Gross Profit $360,000,000 45% Sales 500,000 4,000,000 16,000,000 Operating Expenses Research and Development $104,000,000 13% Average price per sale 75 80 90 Sales, General and Admin. $160,000,000 20% Revenue 37,500,000 320,000,000 1,440,000,000 Non-Recurring Items $16,000,000 2% Gross profit 5,625,000 48,000,000 216,000,000 Other Operating Items $8,000,000 1% Expenses Operating Income $72,000,000 9% Sales & marketing 5,062,500 38,400,000 151,200,000 70% Add'l income/expense items $8,000,000 1% Customer service 1,687,500 9,600,000 21,600,000 10% Earnings Before Interest and Tax $80,000,000 10% Product development 562,500 2,400,000 10,800,000 5% Interest Expense $8,800,000 1% Earnings Before Tax $71,200,000 9% Research 281,250 2,400,000 4,320,000 2% Income Tax $21,360,000 3% Total expenses 7,593,750 52,800,000 187,920,000 Net Income $49,840,000 6% Column widths are set here in PowerPoint
Invoice Destination-formatted table. Text is also linked. INVOICE Invoice date: 2-May-2025 Qty Product Unit Price ($) Line Total ($) 1 Product A $1,000.00 $1,000.00 Due date: 1-Jun-2025 5 Product B $1,500.00 $7,500.00 12345 Invoice # 2 Product C $2,000.00 $4,000.00 1 Product G $4,000.00 $4,000.00 To: Customer Name 123 Main Street New York, NY 10011 Subtotal $16,500.00 Currency is U.S. Dollars Sales Tax $1,650.00 Total $18,150.00 MAKE ALL CHECKS PAYABLE TO: CREATE & CO Thank you for your business! CREATE & CO. | 123 MAIN ST |SEATTLE, WA 78910 |PHONE: 111-222-333 |FAX: 111-222-333
Sales Tracking/Reporting Flex table. Columns widths remain (they are set here in PPT). SHIPPING CHARGE PER ITEM SHIPPING COST PER ITEM COST PER ITEM MARKUP PERCENTAGE TOTAL REVENUE PROFIT PER ITEM TOTAL INCOME PRODUCT NAME TOTAL SOLD RETURNS ITEM 1 ITEM 2 ITEM 3 ITEM 4 ITEM 5 ITEM 6 ITEM 7 ITEM 8 $50.00 $24.50 $19.50 $17.50 $14.50 $11.00 $49.00 $24.50 83.00% 87.00% 75.00% 90.00% 95.00% 100.00% 65.00% 92.00% 22 52 28 55 40 60 37 44 $2,013.00 $2,382.38 $955.50 $1,828.75 $1,131.00 $1,320.00 $2,991.45 $2,069.76 $5.00 $5.00 $5.00 $5.00 $5.00 $5.00 $5.00 $5.00 $2.50 $2.50 $2.50 $2.50 $2.50 $2.50 $2.50 $2.50 $44.00 $23.82 $17.13 $18.25 $16.28 $13.50 $34.35 $25.04 0 1 0 0 0 0 2 0 $968.00 $1,217.07 $479.50 $1,003.75 $651.00 $810.00 $1,207.25 $1,101.76 This chart is updated based on data in the range r_RevProfitForChart. It could be formatted to look like Excel (e.g. paste from Excel). PRODUCT COSTS, PROFIT, AND REVENUE $1,207 $1,217 $968 $1,102 $1,004 $810 $1,784 $651 $480 $1,165 $1,045 $968 $825 $510 $480 $476 ITEM 1 ITEM 2 ITEM 3 ITEM 4 ITEM 5 ITEM 6 ITEM 7 ITEM 8 COST PROFIT
Lists and Transactions These tables are destination-formatted. They also demonstrate that tables can easily expand/contract based on source table. Tables can be configured so hidden or filtered rows/columns are excluded. SKU SP7875 TR87680 MK676554 BM87684 BH67655 DESCRIPTION Item 1 Item 2 Item 3 Item 7 Item 8 BIN # T345 T345 T5789 T349 T5789 LOCATION Row 2, slot 1 Row 2, slot 1 Row 1, slot 1 Row 1, slot 2 Row 1, slot 1 UNIT Each Each Each Each Each Package (5 ct) Each Each QTY REORDER QTY COST INVENTORY VALUE REORDER 0 0 0 0 0 20 30 10 10 19 10 15 30 40 600 1200 5 5 5 50 10 100 57 10 3 1 0 0 WT98768 TS3456 WDG123 Item 9 Item 10 Item 11 T9875 T349 T349 Row 2, slot 2 Row 1, slot 2 Row 1, slot 2 20 15 25 30 14 60 280 900 200 8 15 8 This Destination table was pasted with source formatting, then linked. Merchant The Phone Company Northwind Electric Cars Coho Vineyard Bellows College Trey Research Date Category Communications Transportation Restaurant Education Other Amount $120.00 $142.00 $33.00 $350.00 $135.00 5/2/2025 5/1/2025 4/29/2025 4/28/2025 4/27/2025
TCO Comparison with dynamic text narrative This Destination-formatted table was pasted with source formatting, edited, then linked. Current On-Premises Solution Cloud Equivalent Cost Component 5-Year Cost Calculation and Assumptions 5-Year Cost Calculation and Assumptions Current total licensing costs = $185,097/yr, Total licensing costs after the hardware refresh = $293,977/yr; SQL Server Enterprise License SA Licenses at $3,437 each: Current (51) = $175,287/yr, Refresh (81) = $278,397/yr; System Center Standard Edition SA Licenses at $192 each: Current (51) = $9,810/yr, Refresh (81) = $15,580/yr Provisioned analytics compute base monthly cost is $8,760 (online 70% of the time) with 16% discount = $61,811 in year 1 Compute $1,469,884 $370,863 Primary storage: 57.5TB of raw data with compression ratio of 3.0 = 19.2 TB of needed storage capacity at $23.00 per TB per month = $5,290 in year 1; Geo-redundant Storage Disaster Recovery: copy of primary storage = $13,236 in year 1; Standard (blob, data lake, dev, backup, staging) storage: 100% of primary data with compression ratio of 2.0 = 28.8TB of needed storage capacity at $0.0184 per GB per month = $6,348 in year 1; Archive storage: 100% of primary data with compression ratio of 5.0 = 11.5TB of needed storage capacity at $0.0020 per GB per month = $276 in year 1; Storage transaction costs (read/write operations) = $5,030 in year 1. Total storage cost in year 1 is $30,180 Hardware refresh cost - compute: HW cost per core ($1,164) * # of cores needed in year 5 (161) = $187,458; Hardware refresh cost - storage: Local disk/SAN-HDD/SSD - cost per GB ($0.400) * Needed Capacity in year 5 (GB) (301,704) = $120,681; Hardware refresh cost - networking = $46,221; Total license costs (added new licenses only) = $435,521 [30 new SQL Server Enterprise License licenses at $13,748 = $412,440; 30 new System Center Standard Edition licenses at $769 = $23,081] Storage + Hardware Refresh $871,043 $194,723 8.0% * $91,991 Azure Synapse compute + storage spend = $7,359 in Unified Support Core (or similar) cost in year 1 Support $80,526 Microsoft Premier Support is estimated to cost $16,105 in year 1. $45,247 877 hours of internal labor effort at $60 per hour = $52,774 + 877 hours of external (service provider) labor effort at $150 per hour = $131,502 + other migration cost = $1,000, totaling $185,276 Migration $0 No migration costs $185,276 0.27 IT FTEs (Full Time Equivalents) are required to manage the servers (assumes each FTE can manage 100 servers) * $109,800 annual fully-burdened cost per FTE = $29,646 in year 1. 0.06 IT FTEs (Full Time Equivalents) are required to manage the Azure services (assumes each FTE can manage 200 servers with 6 physical cores in each server) * $109,800 annual fully- burdened cost per FTE = $6,588 in year 1. Administration Labor $148,230 $39,528 27 RUs (Rack Units) required for compute and 9 RUs required for storage * $340 annual facilities cost per RU = $12,240 in year 1. Facilities $65,620 $0 None 2.88 TBs of bandwidth per month * $0.150 monthly Internet service provider cost per GB * 1000 GB/TB = $5,175 in year 1. 2.88 TBs of data transferred out of Azure per month * $0.087 Azure outbound cost per GB * 1000 GB/TB = $3,002 in year 1. Inbound transfers are free. Data Bandwidth $34,892 $20,237 64 average watts per core * 161.051 cores = 10,367 watts * $0.133 per kilowatt- hour * 24hours/day * 365 days/year * 1000 watts/kW = $12,114 in year 1. Electricity $60,572 $0 None $124,030 Dev/test resource cost and $0 Other = $124,030 'Other Costs' in year 1. Other (Dev, Test, etc.) $273,077 $63,107 $10,235 Dev/test resource cost in year 1 Total $3,003,843 $918,981 Example Summary Text: Total cloud TCO is $918,981. That is a 69% savings.
Cost-Benefit-ROI Analysis This chart was pasted in Word and PPT with destination format (not as picture), then linked to r_CostBenChartData (4 columns). These Destination-formatted tables were pasted from Excel with Source format, then linked, then adjusted to improve appearance, such as added margins and removed input cell coloring in the cost table. Costs, Benefits, and Payback by Year $5,000 Annual On- Going Costs Benefits Cumulative Total (5-Year) One Time $4,000 $1,279,053 $272,330 $2,640,703 Total Costs $0 $1,283,929 $6,419,645 Total Benefits $3,000 $3,778,942 Net Benefits Thousands $2,000 $1,000 Annual On- Going Cost Type Total (5-Year) One Time $0 $2,047,320 Vendor Costs $1,060,720 $197,320 $100,800 Internal Costs $48,000 $10,560 -$1,000 $390,583 Internal Labor $151,000 $47,917 $102,000 3rd Party Services $19,333 $16,533 -$2,000 $1,279,053 $272,330 $2,640,703 Total Initial Year 1 -$272,330 $1,283,929 -$267,454 Year 2 -$272,330 $1,283,929 $744,145 Year 3 -$272,330 $1,283,929 $1,755,744 Year 4 -$272,330 $1,283,929 $2,767,343 Year 5 -$272,330 $1,283,929 $3,778,942 Costs Benefits Cumulative -$1,279,053 $0 -$1,279,053 Example Summary Text: Contoso can realize $6,419,645 in benefits with an investment of only $2,640,703 -- that's an ROI of 143%.
Discounted Cash Flow DCF Calculations by Year Flex table $ Millions 2021A 2022A 2023A 2024A 2025A 2026F 2027F 2028F 2029F 2030F 2031F EBITDA (107.74) 15.77 17.10 18.94 21.14 23.83 24.27 26.20 27.73 28.89 29.55 Depreciation & Amortization 2.14 2.40 2.75 3.17 3.68 2.09 2.33 2.54 2.72 2.86 EBIT 13.63 14.70 16.20 17.98 20.15 22.17 23.87 25.19 26.16 26.69 Taxes 9.54 9.75 10.04 10.39 10.81 11.20 11.53 4.89 5.08 5.18 Capex (3.08) (3.32) (3.66) (4.06) (4.55) (2.50) (2.69) (2.84) (2.95) (3.01) Net Working Capital Change (15.96) 1.49 2.08 2.49 3.03 2.82 2.37 1.84 1.36 0.73 FCF (Free Cash Flow) 6.27 25.03 27.41 29.96 33.12 35.78 37.41 31.62 32.37 32.45 Factor 0.90 0.82 0.74 0.67 0.61 0.55 0.50 0.45 0.41 0.37 Discounted FCF 5.68 20.50 20.32 20.09 20.10 19.66 18.60 14.22 13.18 11.96 DCF Results - Destination-formatted TV (Terminal Value) $448.24 Discounted TV $165.15 PV of CF $164.30 EV (Enterprise Value) $329.45 Net Debt -$646.47 Minority Interest $0.00 Equity Value $975.92
PivotTables Flex (source-formatted) PivotTable Grand Total $67,800 $6,300 $66,000 $32,100 $172,200 Category Accessories Bikes Clothing Components Grand Total 2015 2016 2017 $67,800 $6,300 $2,300 $4,100 $80,500 $23,700 $2,300 $26,000 $40,000 $25,700 $65,700 Destination-formatted PivotTable Category Accessories Bikes Clothing Components $2,300 Grand Total 2015 2016 $67,800 $6,300 $2,300 $4,100 $80,500 2017 Grand Total $67,800 $6,300 $66,000 $32,100 $172,200 $23,700 $40,000 $25,700 $65,700 $26,000 Image of PivotTable
Auto-Hide Rows/Columns Automatically hides/unhides rows/columns based on cell value/formula when you click the "Auto-Hide Rows/Columns" button in Excel, then Submit, then Update Document in PPT. Column A r25c3 r26c3 r28c3 r30c3 r32c3 r33c3 r35c3 r36c3 r38c3 r39c3 Column C r25c5 r26c5 r28c5 r30c5 r32c5 r33c5 r35c5 r36c5 r38c5 r39c5 Column D r25c6 r26c6 r28c6 r30c6 r32c6 r33c6 r35c6 r36c6 r38c6 r39c6 Column F r25c8 r26c8 r28c8 r30c8 r32c8 r33c8 r35c8 r36c8 r38c8 r39c8 Row 1 Row 2 Row 4 Row 6 Row 8 Row 9 Row 11 Row 12 Row 14 Row 15
Dashboards These are images of the Excel ranges and can contain sparklines, conditional formatting, images, charts, etc. Sales Dashboard HR Dashboard