Financials Coverage Group
This content revolves around a group of individuals involved in financial coverage and management. Featuring Tommy, Fan Bill, Kwai, Maurice, Ang, Nick, La Grandeur, Colin, Man, David Lopez, Nick Burakoff, Sai, Senthilkumar, Habib Olapade, Sophia Huard, Andrea Wang, and Alex Mack. The content likely covers a range of topics within the financial sector, showcasing diverse expertise and perspectives.
Download Presentation

Please find below an Image/Link to download the presentation.
The content on the website is provided AS IS for your information and personal use only. It may not be sold, licensed, or shared on other websites without obtaining consent from the author.If you encounter any issues during the download, it is possible that the publisher has removed the file from their server.
You are allowed to download the files provided on this website for personal or commercial use, subject to the condition that they are used lawfully. All files are the property of their respective owners.
The content on the website is provided AS IS for your information and personal use only. It may not be sold, licensed, or shared on other websites without obtaining consent from the author.
E N D
Presentation Transcript
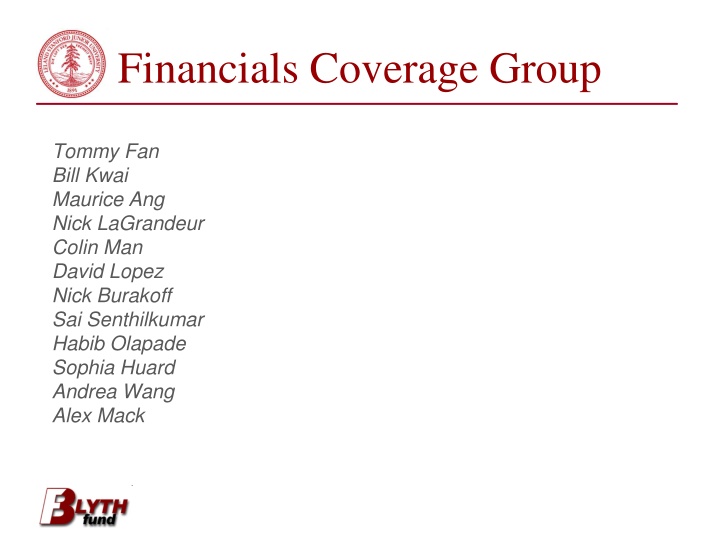
Financials Coverage Group Tommy Fan Bill Kwai Maurice Ang Nick LaGrandeur Colin Man David Lopez Nick Burakoff Sai Senthilkumar Habib Olapade Sophia Huard Andrea Wang Alex Mack
Hedge Funds Hedge Fund is an umbrella term for a diverse industry comprised of funds with vastly different strategies and sizes Compensation performance based 2 and 20 2% total asset value (AUM) as management fee 20% of profits earned (alpha) Managing billions of dollars + High returns = Fund managers making tons of $$$$$$$$
Fund Strategies Aggressive Growth Distressed Securities Emerging Markets Income Macro Market Neutral Market Timing Green = Low Risk Orange = Medium Risk Red = High Risk Short Selling Special Situations Value
Private Equity - Overview Private equity is an asset class for investing in public and non-public companies or physical assets, such as real estate. PE firms seek to invest directly in private companies or acquire private/public companies and capitalize on the investments by selling the company later Investments are less liquid and seek exit after 3-5 years. Fee structures typically consist of a yearly 2% management fee and 20% of gross profits upon sale of the company (2 and 20 structure).
Current State Private Equity fundamentals have been steadily strengthening since the global financial crisis. High asset prices and stiff competition from a new breed of investors, including sovereign wealth funds, state-owned enterprises, pension plans, specialist funds and large family offices pose obstacles to new deals. Such investors are now managing their own investment portfolios and buying companies directly to avoid private equity fees.
Deals and Exits 2013 saw a record number of private equity-backed buyout exits, with 1,348 such exits valued at $303bn witnessed. 2013 also saw a record year for venture capital exits, with 798 recorded throughout the year, the highest number of exits in the period since 2007.
Sector Trends PE firms starting to target retail investors for capital growth KKR, Blackstone, Carlyle open up to investors putting up less than $1 million Coupled with increasing high net worth PE allocation (>23%) Rise of high-performing, sector-focused PE funds Cambridge Associate Report 2001-2010: 2.2x multiple on invested capital (MOIC) and 23.2% IRR as opposed to 1.9x MOIC and 17.55% IRR by generalist funds Middle/lower market challengers: <$500 million under management have outperformed >$500 million in past six years Record high equity valuations, cheap debt = highly leveraged buyouts (>70% debt multiple) Fear of peak demand in PE cycle
Recent Deals and Future Trends TPG $1.05 billion buyout of DTZ real estate services firm KKR & Blackstone standoff over $10 billion of cement facilities Vista Equity Partners $4.3 billion buyout of Tibco Carlyle $700 million buyout of Dealogic Increased international market investment Continued TMT, Consumer and Healthcare M&A activity Regulatory and compliance hurdles, 2015 interest rates Increasingly competitive PE space
Highlights KKR & Co. 1976 - Present Cumulative gross IRR of 25.7% vs 11.9% and 9.3% for S&P 500 Index and MSCI World Index, respectively More than doubled the value of capital from $61.3 billion to $126.5 billion of value Future of KKR Announced deal with Nasdaq to allow investors to trade private equity fund stakes Will allow retail investors to purchase these stakes, who are currently the largest growth area for the investment management business Enhanced focus in its private equity business (% allocated to PE funds): KKR - 65.3% BX - 22.4% Carlyle - 32.1% o o o
Comps EV/EBITDA Comparisons: KKR: 2.34 | BX: 5.53 | OAK: -8.86 | APO: 4.58 | CG: 3.28 Indicates KKR s strong cash flow relative to its competitors P/E Comparisons: KKR: 10.22 | BX: 11.14 | OAK: 11.05 | APO: 14.95 | CG: 13.45 Potentially undervalued
Investment Banking Bulge Bracket The world's largest and most profitable investment banks. Their clients tend to be large corporations and institutions, and governments. Most Bulge Bracket Firms are not solely devoted to investment banking operations E.G. Bank of America, Barclays, J.P. Morgan, UBS, Credit Suisse, Morgan Stanley, Citigroup, Goldman Sachs, and Deutsche Bank Boutique Investment Banks - A boutique investment bank is an entity that specializes in some subset of investment banking. Boutique banks generally work on smaller deals involving middle-market companies, typically less than a billion dollars in revenues, and usually assist on the sell-side in mergers and acquisitions transactions. E. G. Lazard, Blackstone, Jefferies &Co, and Morgan Keegan & Co.
Investment Banking Operations Corporate Finance IBs will help companies raise funds by evaluating the firm's financial needs and raising the appropriate type of capital that best fits the needs of the company. Initial Public Offerings (IPOs) IBs help companies raise cash for future operations and/or expansion through the sale of stocks or bonds or underwriting. Mergers and Acquisitions (M&A) IBs will be retained by both buy side and sell side parties in order to structure a merger or a combination of two companies seeking to form a new company or an acquisition or the purchase of one company by another in which no new company is formed. When facilitating M&As, bankers help finalize the purchase price, structure the deal, and ensure a smooth transaction. Sales and Trading (S&T) IBs will often make a market in certain securities and execute sales for wealthy and institutional investors such as central banks, pension funds, mutual funds, and large corporations by communicating orders to the appropriate trading desk. Sale side traders make money through commissions on trades made through their firms or, increasingly, as a percentage of their clients assets with the firm. IBs will also engage in proprietary trading with their own funds in order to leverage and manage risk. (although the Dodd-Frank Bill has added more regulation to this venture). Traders make only off of a spread.
Investment Banking Financial Metrics Bank of America UBS Financial Metrics Barclays Citigroup Credit Suisse Goldman Sachs Morgan Stanley J.P. Morgan Deutsche Bank S&P Average 43.7 18.4 68.5 Price/ Earnings 3.1 17.9 11.0 14.2 11.2 N/A 18.6 .8 1.2 .9 Price/Book .6 .8 1.1 1.0 1.1 .5 2.7 2.1 2.4 1.6 Price/Sales .1 2.1 2.6 2.1 2.4 .9 1.8 4.1 4.0 -2.3 Price/Cash Flow -.1 10.1 -8.8 2.7 243.9 1.9 11.5 .20 .28 Dividend .25 .04 .79 2.4 .4 1.6 .52 N/A 1.20% 1.6% Yield 1.7% .1% 3% 1.3% 1.1% 2.7% 1.8% NA .4 .95 EPS .36 2.91 .39 17.29 2.5 5.4 -.15 N/A 1.59 .94 Beta 1.42 1.94 1.83 1.9 2.45 1.93 1.45 N/A UBS: Third quarter profit increased 32% despite 1.8B loss in litigation charges Bank of America: Received approval from the Federal Reserve to raise its divided payout to more competitive levels relative to industry competitors. Anticipated legal costs from the 2008 crisis are going down (SCOTUS has agreed to hear two BAC cases involving mortgage default payments and a ruling in favor of BAC is highly anticipated).
Commercial Banking Financial institutions that profit from the creation and flow of money Financial intermediaries standing between depositors who supply capital & borrowers who demand capital Heavily regulated businesses What they do : Provide Safety to their Consumers Act as Payment Agents within a Country & Between Nations Issue debit cards & arrange wire transfers with other institutions Accept Deposits / Make Loans They accept deposits from customers, raise capital from investors or lenders, & then use that money to make loans, buy securities & provide other financial services to customers. These loans are then used by people & businesses to buy goods or expand business operations, leading to more deposited funds that make their way to banks. If they can lend money at a higher interest rate than they have to pay for funds and operating costs, they make money.
Recent Industry News Companies such as Square are taking away from traditional banks o Square Capital - program to finance small businesses (essentially give them loans by buying future cash flows ) Banks interact with each other as well o Recent collusion scandal 6 banks (HSBC, Citigroup, BoA, RBS, UBS, JP Morgan) o Manipulated foreign exchange rates of the British Pound and Japanese Yen
Highlight HSBC Provides banking and financial services through four segments namely Retail Banking and Wealth Management, Commercial Banking, Global Banking and Markets and Global Private Banking Will only pay a fraction of the Forex scandal fines Advantage: network corresponds with markets relevant to international financial flows, access & exposure to high-growth markets and businesses, & strong balance sheet Manage the bank globally. Goal: continue to streamline, globalise & simplify processes and procedures to generate sustainable savings, releasing capacity to further invest in growing the business
Market Interaction At least 10%-12% of assets in reserve Rest of assets are invested in: Government Bonds (68.4%) Common Stock (10.9%) Mortgages (6.5%) Real Estate (<5.0%) Derivatives (<5.0%) Profits depends on return on investment
Highlights P&C Averages Average Annual Returns: 10.32% S&P Insurance Index Annual Returns: 6.62% Average Annual Returns: 24.06% Dividend Yield: 0.93% Dividend Yield: 1.9% Dividend Yield: 1.68% P/E Ratio: 8.80 P/E Ratio: 23.39 P/E Ratio: 10.60 Net Income Doubled in 2013
Q&A Questions?
