First-Year Retention Factors in Higher Education
Explore how pre-college student and institutional characteristics impact first-year retention in higher education. The study utilizes data from the 2004 CIRP Freshman Survey and 2005 National Student Clearinghouse to analyze factors influencing student re-enrollment in fall 2005, providing insights for institutions to improve retention rates.

Download Presentation

Please find below an Image/Link to download the presentation.
The content on the website is provided AS IS for your information and personal use only. It may not be sold, licensed, or shared on other websites without obtaining consent from the author. If you encounter any issues during the download, it is possible that the publisher has removed the file from their server.
You are allowed to download the files provided on this website for personal or commercial use, subject to the condition that they are used lawfully. All files are the property of their respective owners.
The content on the website is provided AS IS for your information and personal use only. It may not be sold, licensed, or shared on other websites without obtaining consent from the author.
E N D
Presentation Transcript
CALCULATING RETURN: USING CALCULATING RETURN: USING STUDENT INPUT DATA TO STUDENT INPUT DATA TO CALCULATE FIRST CALCULATE FIRST- -YEAR RETENTION YEAR RETENTION Kevin Eagan, Ph.D. Ellen Bara Stolzenberg, Ph.D. Higher Education Research Institute University of California, Los Angeles
Introduction Increasing degree attainment rates is a national priority Living communities, first-year seminars, and supplemental instruction are among institutional efforts that have received a lot of attention as best practices
Despite concerted efforts, attrition remains highest during first-year of college 20 18.4 15 % of Students 10 8.9 8.7 5 3.4 1.3 0 Year 1 Year 2 Year 3 Year 4 Year 5
Developing strategies To best tailor campus-facilitated efforts, it is necessary to better understand characteristics of incoming class Who are we serving and what are their chances of being retained? Would increasing certain efforts help the success of the different types of students we serve?
Purpose To examine how pre-college student and institutional characteristics are related to first-year retention To provide institutions with a first-year retention calculator
Background: HERIs Graduation Calculator Created in 2011 Allows institutions to compare expected rates to actual rates Basic calculator uses race, sex, high school GPA, and SAT scores Larger calculator uses 169 variables Improved correct classification of cases by about 5%
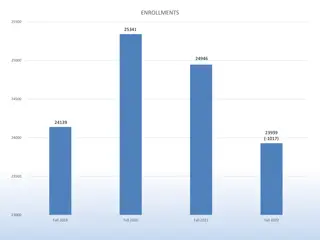
Methods Data and Sample 2004 CIRP Freshman Survey 2005 National Student Clearinghouse 210,056 students at 356 four-year colleges and universities Weighted by institution type and sex to represent the 1.4 million first-time, full-time students entering 4-year institutions in 2004 Analysis HGLM
Variables Dependent variable (NSC) Re-enrollment at same institution in Fall 2005 Independent variables (TFS) Demographic Pre-college experiences and academic achievement Financial considerations and college choice Expectations and intended major Institutional characteristics
Results: Demographics INCREASED ODDS Asian American Black Higher Income DECREASED ODDS American Indian Multiracial Native English Speaker First Generation
First-Year Retention Rates, by Race 100 90.1 90 82.0 % of Students 79.7 78.3 80 76.5 70 67.4 60 50 American Indian Asian Black Latina/o White Multiracial
First-Year Retention Rates, by Income 100 90 86.4 % of Students 85.3 80 79.2 77.4 70 72.9 60 50 Less than $10k $40k to $49,999 $250k or more
Results: Pre-College Experiences and Academic Achievement INCREASED ODDS Felt Overwhelmed Volunteer work Hrs/wk: Student Clubs Hrs/wk: Homework SAT Score Emotional Health DECREASED ODDS Felt Depressed Social Self-Concept
Retention Rates, by Emotional Health 100 90 83.4 83.4 80.7 % of Students 80 76.8 72.2 70 60 50 Lowest 10% Below Average Average Above Average Highest 10%
Results: Financial Considerations and College Choice INCREASED ODDS Aid: Family Resources Aid: Grants/Scholarships First Choice College Reason for Choosing: Cost College Reputation Reason for College: To Gain a General Education DECREASED ODDS Aid: Loans Aid: My Own Resources Financial Concerns: Major
Retention Rates, by Financial Concerns 100 90 83.4 % of Students 82.3 80 74.7 70 60 50 Major Some None
Results: Expectations and Intended Major INCREASED ODDS Expectation: Change Major Likelihood of College Involvement Major: Education DECREASED ODDS Expectation: Transfer Major: STEM
Retention Rates, by Likelihood of Involvement 100 90 87.5 % of Students 80 76.8 72.2 70 60 50 Low Group Medium Group High Group
Future Research College Choice Financial Concerns Types of Financial Support