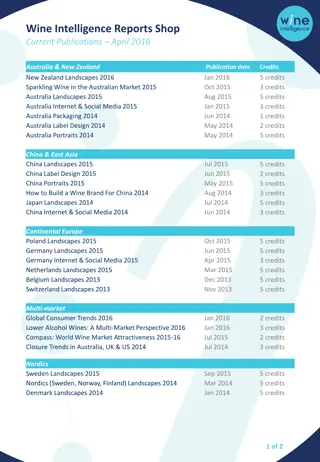
Fiscal Sustainability in the Nordics: Current Situation and Rules

Delve into the fiscal frameworks and sustainability in the Nordic countries, examining the fiscal balance, government net wealth, debt, and rules governing fiscal policy. Explore targets, constraints, and adjustment mechanisms in maintaining fiscal balance and sustainability. Understand the specific structural deficit targets for each country and how exceptional circumstances may impact fiscal policies.

Download Presentation

Please find below an Image/Link to download the presentation.
The content on the website is provided AS IS for your information and personal use only. It may not be sold, licensed, or shared on other websites without obtaining consent from the author.If you encounter any issues during the download, it is possible that the publisher has removed the file from their server.
You are allowed to download the files provided on this website for personal or commercial use, subject to the condition that they are used lawfully. All files are the property of their respective owners.
The content on the website is provided AS IS for your information and personal use only. It may not be sold, licensed, or shared on other websites without obtaining consent from the author.
E N D
Presentation Transcript
Fiscal Fiscal frameworks frameworks and sustainability sustainability in the Nordics in the Nordics and fiscal fiscal Lars Calmfors Webinar 3 April 2020 Nordregio, Swedish Fiscal Policy Council and Nordic Council of Ministers
My presentation My presentation Current fiscal situation Fiscal rules Fiscal-policy monitoring Fiscal sustainability analyses
Fiscal Fiscal balance balance, , percent percent of of GDP GDP
Fiscal Fiscal balance balance, , percent percent of of GDP GDP
General General government government net percent percent of of GDP GDP net financial financial wealth wealth, ,
General General government government net percent percent of of GDP GDP net financial financial wealth wealth, ,
General General government government consolidated percent percent of of GDP GDP consolidated gross gross debt debt, ,
Fiscal Fiscal rules rules Fiscal-balance targets/constraints Government debt targets Expenditure ceilings Economic results of local governments
Fiscal-balance constraint general government Fiscal-balance target general government Subsector fiscal targets Adjustment Escape clause Denmark Structural deficit 0.5% of GDP Structural balance 2025 Municipal sector, regional sector 0.5% of GDP annually Exceptional circumstances Finland Structural deficit 0.5% of GDP Structural balance 2023 Central government, municipal sector, social-security funds 0.5% of GDP annually Exceptional circumstances Iceland Actual deficit 2.5% of GDP Actual surplus over five-year period Municipal sector Deviation during 3 years is possible Norway Structural deficit for mainland Norway = expected return of wealth fund Structural deficit can vary over the business cycle Sweden 1/3% of GDP over business cycle: structural- balance target 0.4 0.5% of GDP annually Adjustment should take cyclical situation into account
Debt rules Iceland: Debt ceiling of 30% of GDP Sweden: (Maastricht) debt anchor of 35% of GDP
Expenditure Expenditureceilings ceilings Sector Scope Time Type Compulsory action Escape clause Denmark Central government: operating expediture and transfers Municipalities and regions: operating expenditure Interest payments, investment expenditure and unem- ployment- related expenditure excluded Four years ahead Expenditure in real terms Overdraft must be compensated unless taxes are raised; sanctions against municipalities and regions Yes Finland Central government Interest payments, financial investment and cyclically dependent expenditure excluded Four years ahead Expenditure in real terms Not legally binding, but no violations Yes Sweden Central government Interest payments excluded Three years ahead Expenditure in nominal terms Government must act against overdrafts No
Budget Budget rules rules for for individual individual municipalities municipalities/regions /regions Budget-balance requirements Adjustment Sanctions/actions Denmark Borrowing only for some investment expenditure Reduction of government grants; government intervention Finland Ex-ante budget balance Accumulated deficits to be covered within four years Negotiations with government; forced mergers Iceland Ex-ante budget balance Maximum debt: 150% of regular revenues Government intervention; forced mergers Norway Ex-ante budget balance Deficit to be covered within two years Government intervention Sweden Ex-ante budget balance Deficit to be covered within three years None
Conclusions Conclusions on on fiscal fiscal frameworks frameworks Denmark has the strictest fiscal framework (in addition to EU rules) - law-based - tough expenditure ceilings - possibilities to sanction local governments Norway has the least strict framework (and no EU rules) - not law-based - no expenditure ceilings But rules have been complied with in both Denmark and Norway - political consensus more important than formal rules?
Fiscal Fiscal councils councils Denmark Finland Iceland Norway Sweden Fiscal Council Economic Council(s) Economic Policy Council Fiscal Council Fiscal Policy Council Legal basis Law regarding the council(s) Government regulation Budget law Government regulation Other monitoring institutions National Audit Office Konjunkturinsti- tutet, Ekonomi- styrningsverket, Riksrevisionen Remit Fiscal policy, other economic policy, environmental policy Fiscal policy, other economic policy and economic-policy institutions Fiscal policy Fiscal policy, (growth, employ- ment and income distribution as well as policy transparency) Own models and forecasts Yes Not yet No No
Denmark Finland Iceland Norway Sweden Link to budget process Evaluation of main govern- ment policy documents in parliamentary budget process Report after spring fiscal policy bill; public hearing in the finance committee Media coverage Large Large ? Large Qualifications Knowledge in economics; in practice university professors Knowledge on public finances; PhD for chair, university degree for others Scientific competence in economics or practical economic-policy expirience Scientific expertise; in practice university professors Appointment procedure Proposal from council Proposals from economics departments and Academy of Finland Proposal from Prime Minister and parliament, respectively Proposal from nomination committee: heads of govern- ment bodies and politicians Secretariat 20-25 persons 2 persons 0 person 5 persons
Conclusions Conclusions on Nordic on Nordic fiscal fiscal councils councils Resources not commensurate with remits Iceland, Finland and probably also Sweden No budget autonomy as recommended in OECD guidelines Strong real standing but weak formal guarantees for independence - potential risks No fiscal council in Norway - not in line with strong corporatist tradition Norwegian model
Sustainable Sustainable public public finances finances The ability of a government to service its debt at any point of time The intertemporal budget constraint must be fullfilled - current net financial wealth at least equal to present value of all future primary deficits (shares of GDP) - current net debt at most equal to present value of all future primary surpluses (shares of GDP) The path for the primary balance must be economically and politically feasible Difficult to judge - current government cannot make binding commitments on the part of future governments Basic assumption: interest rate > growth rate
Sustainability Sustainability of of current current fiscal fiscal policy policy Unchanged policy Constant tax rates Transfer levels to households rise in proportion to wages - but pensions follow the rules in the pension system Collective public consumption rises in proportion to GDP or population Expenditure per user on individual public consumption in various socioeconomic groups rises in proportion to wages
Other Other important important assumptions assumptions Lower productivtiy growth in welfare services than in goods production Constant wage share in the private sector Same wage increase in private and in public sector Gradual normalisation of interest-growth differential Unchanged employment rate and average working time in various socioeconomic groups Some form of healthy ageing
Sustainability Sustainability indicators indicators S2 indicator - the immediate and permanent strengthening of the primary balance as a share of GDP which would exactly fulfill the intertemporal budget constraint and stabilise net debt at some level S1 indicator - the immediate and permanent strengthening of the primary balance as a share of GDP which implies that a certain debt ratio (ratio of net financial wealth to GDP) is reached in a given year Developments of net financial wealth and debt as ratios of GDP
The S2 The S2 indicator indicator Advantages Information on fiscal sustainability condensed into one metric Allows comparisons between paths and countries Disadvantages Too much information squeezed into one metric? The exact path matters - dangerous with large deficits in the near future even with large projected surpluses in a distant future S2 = 0 can imply very different long-run wealth and debt ratios
The S1 The S1 indicator indicator Which debt ratio should be targeted? - 60% of GDP as in EU rules? - appropriate safety margin to 60%? - own debt target (35% of GDP as in Sweden)? - safety margin to critical level? - how determine critical level? Maastricht debt or net financial wealth?
Old Old- -age age dependency dependency ratio ratio (65+ as a (65+ as a share shareof of 20 20 64), 64), percent percent
Oldest Oldest- -age age dependency dependency ratio ratio (80+ as (80+ as share share of of 20 20- -64), 64), percent percent
Fiscal Fiscal sustainability sustainability analyses analyses Denmark - Ministry of Finance - The Economic Council(s) - (DREAM) Finland - Ministry of Finland - Bank of Finland - (ETLA) - (Economic Policy Council) Norway - Ministry of Finance - (Statistics Norway) Sweden - Ministry of Finance - National Institute of Economic Research - ((Fiscal Policy Council))
Observations Observations regarding analyses analyses 1 1 regarding fiscal fiscal sustainability sustainability Similar methods for projections of fiscal balance, net financial wealth and Maastricth debt In general highly competent analyses Large emphasis on S2 indicator in Denmark and Finland - operational role for policy - Denmark: S2 indicator should not be positive - Finland: Need for adjustment already in the short run if positive indicator Over time reduced emphasis on S2 indicator in Sweden - increasing emphasis on paths for fiscal balance, net financial wealth and debt
Observations Observations regarding analyses analyses 2 2 regarding fiscal fiscal sustainability sustainability Usually no S2 calculations in Norway - path for fiscal gap ( inndekningsbehovet ): every second year - required strengthening of central-government non-oil structural balance to reach overall central government budget balance (after withdrawal of 3% of wealth fund s market value = expected real return) Surprisingly few S1 calculations Calculations mainly based on extrapolation method - dynamic OLG-models used by DREAM, ETLA (and National Institute of Economic Research)
Observations Observations regarding analyses analyses 3 3 regarding fiscal fiscal sustainability sustainability Extensive and pedagogical explanations in Denmark, Norway and Sweden - in particular the Economic Council(s) and the National Institute of Economic Research Insufficient pedagogics in Finland Ministry of Finance Accounts of differences between various calculations - Sweden - Denmark: in particular the Economic Council(s) but not the Ministry of Finance - Finland: not at all
Observations Observations regarding analyses analyses 4 4 regarding fiscal fiscal sustainability sustainability The analysis of the Swedish Ministry of Finance stands out - assumption of unchanged standard in welfare services, unchanged exit age from labour market and no healthy ageing - expenditure per user in a given socioeconomic group falls relative to wages - deviation from historical patterns - net effect: too optimistic evaluation Norwegian Ministry of Finance - pedagogical calculations of how large adjustments are necessary if only one instrument were to be used - tax on labour income, user charges, productivity growth in welfare service, higher employment
S2 S2 indicator indicator, , percent percent of of GDP GDP Denmark -2 -1 Finland 3 5 Sweden -1 1 Norway 3 4 Norway fiscal gap 2060 (2100) 5,3 (9,5)
Reasons Reasons to be to be more more pessimistic pessimistic Relative wages in welfare sevices need to rise in order to recruit personell Increases in defence expenditure Corona crisis
Corona Corona crisis crisis: Sweden : Sweden 6% GDP fall 2020 Fiscal deficit: 5% of GDP Maastricht debt increase by 7 8% of GDP (to 42 43% of GDP) 10% GDP fall 2020 Fiscal deficit: 7% of GDP Maastricht debt increase by 11 12% of GDP (to 46 47% of GDP)