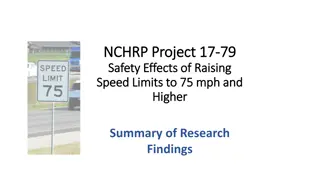
Explore the latest data on smoothness classifications, IRI limits, access roads, and incentive details from the Florida Department of Transportation. Gain insights into lane mile incentives and disincentives per class and district.
Please find below an Image/Link to download the presentation.
The content on the website is provided AS IS for your information and personal use only. It may not be sold, licensed, or shared on other websites without obtaining consent from the author. If you encounter any issues during the download, it is possible that the publisher has removed the file from their server.
You are allowed to download the files provided on this website for personal or commercial use, subject to the condition that they are used lawfully. All files are the property of their respective owners.
The content on the website is provided AS IS for your information and personal use only. It may not be sold, licensed, or shared on other websites without obtaining consent from the author.
E N D
Presentation Transcript
Florida Department of TRANSPORTATION Smoothness Class IRI Limits Non-Limited Access Roads Smoothness Committee November 2020
IRI Classification Limits IRI Classification Limits 27 - 41 42 - 49 50 - 60 61 - 84 85 - 99 Class 1 2 3 4 5 Florida Department of Transportation
IRI Class Limits and IRI Pay Limits IRI Pay Limits Full Pay Disincentive 37 - 42 43 - 55 53 - 62 63 - 85 86 - 105 IRI Class Limits 27 - 41 42 - 49 50 - 60 61 - 84 85 - 99 Class Incentive 36 42 52 62 85 R&R >95 >95 >110 >125 >125 1 2 3 4 5 43 - 95 56 - 95 63 - 110 86 - 125 106 - 125 Florida Department of Transportation
Limited vs Non-Limited Access Roads Data 6.0 Limted Access 2005-2010 5.0 Limited Access 2014-2019 Non-Limited Access 2005-2010 4.0 Percent of LOTs Non-Limited Access 2014-2019 3.0 2.0 1.0 0.0 0 10 20 30 40 International Roughness Index (IRI) - in/mile 50 60 70 80 90 100 110 120 130 140 150 Florida Department of Transportation
Incentive/Disincentive per class and per district Per District Incentive Lane Miles $104,057 $115,897 $81,014 $53,396 $94,085 $33,655 $174,167 $656,271 District 1 2 3 4 5 6 7 Total Inc/Mile $124 $88 $56 $131 $169 $166 $266 $121 837 1,313 1,447 409 558 203 655 5,421 Florida Department of Transportation
Incentive/Disincentive per class and per district Per Class Class 1 2 3 4 5 Incentive Lane Miles Inc/Mile $61,419 1,939 $209,009 1,961 $262,406 1,208 $122,387 310 $1,050 3 $604 $706 $1,678 $2,487 $432 Total $656,271 5,421 $121 Florida Department of Transportation
Incentive/Disincentive per class and per district - Breakdown Incentive Class 3 $5,248 $34,912 $14,462 $14,073 $52,726 $7,511 $133,473 $262,406 District 1 2 3 4 5 6 7 Total Class 1 $5,270 $12,388 $44,807 $2,588 -$1,815 $0 -$1,819 $61,419 Class 2 $45,718 $46,421 $22,579 $34,071 $34,562 $125 $25,533 $209,009 Class 4 $48,020 $22,175 -$835 $2,664 $8,755 $24,992 $16,615 $122,387 Class 5 -$200 $0 $0 $0 -$142 $1,028 $364 $1,050 Total $104,057 $115,897 $81,014 $53,396 $94,085 $33,655 $174,167 $656,271 Florida Department of Transportation
Total lane miles per class and per district - Breakdown Lane-Miles Class 3 212 158 24 70 264 100 379 1208 District 1 2 3 4 5 6 7 Total Class 1 207 626 1014 4 71 0 16 1939 Class 2 343 487 408 263 202 44 214 1961 Class 4 74 41 1 72 19 58 45 310 Class 5 1 0 0 0 1 1 0 3 Total 838 1313 1447 409 558 203 655 5421 Florida Department of Transportation
Inc/mile per class and per district - Breakdown Incentive/mile Class 3 District 1 2 3 4 5 6 7 Total Class 1 Class 2 Class 4 Class 5 Total $25 $133 $25 $649 -$305 $124 $20 $95 $221 $538 $0 $88 $44 $55 $604 $0 $0 $56 $690 $130 $202 $37 $0 $131 -$25 $171 $199 $456 -$136 $169 $0 $3 $75 $435 $874 $166 -$114 $119 $352 $372 $0 $266 $640 $706 $1,678 $2,487 $432 $121 Florida Department of Transportation