Florida Workforce System Overview and Roles | Performance Indicators
Explore the roles and responsibilities within Florida's workforce system, including the structure, service delivery model, and primary indicators of performance. Learn about the key entities involved, such as the Department of Economic Opportunity and CareerSource Florida, in driving workforce development initiatives. Understand the importance of local elected officials in overseeing workforce innovation and opportunity programs. Discover the performance indicators set by the Workforce Innovation and Opportunity Act (WIOA) to evaluate the effectiveness of workforce development efforts.

Download Presentation

Please find below an Image/Link to download the presentation.
The content on the website is provided AS IS for your information and personal use only. It may not be sold, licensed, or shared on other websites without obtaining consent from the author. If you encounter any issues during the download, it is possible that the publisher has removed the file from their server.
You are allowed to download the files provided on this website for personal or commercial use, subject to the condition that they are used lawfully. All files are the property of their respective owners.
The content on the website is provided AS IS for your information and personal use only. It may not be sold, licensed, or shared on other websites without obtaining consent from the author.
E N D
Presentation Transcript
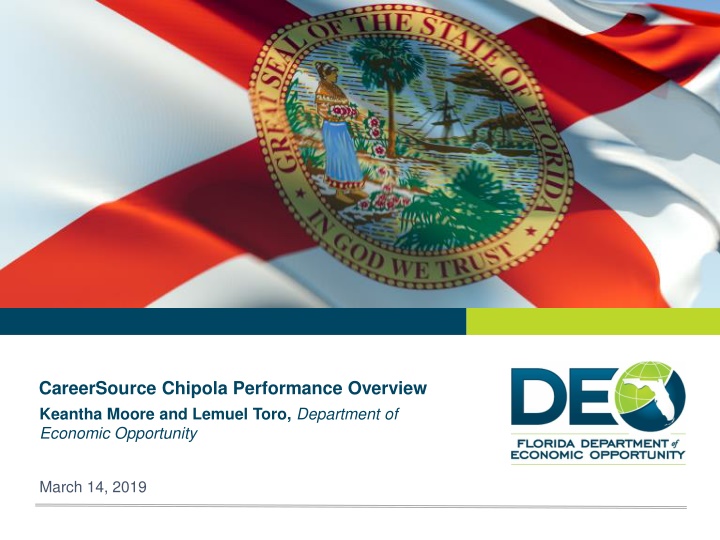
CareerSource Chipola Performance Overview Keantha Moore and Lemuel Toro, Department of Economic Opportunity March 14, 2019
AGENDA Workforce Structure and Service Delivery Model Roles and Responsibilities Program Year 2017 Primary Indicators of Performance Programmatic Monitoring Activity Local Area Financial Overview Workforce Trends 2
FLORIDAS WORKFORCE SYSTEM United States Department of Health and Human Services United States Department of Agriculture United States Department of Labor General Revenue Governor Department of Economic Opportunity (DEO) CareerSource Florida (State Workforce Policy Board) Legislature 24 Local Workforce Development Boards Local Elected Officials Community Based Organizations Economic Development Partners Workforce Service Delivery (Over 75 Career Centers) Community Partners Training and Service Providers Educational Entities Job Seekers Employers 3
ROLES AND RESPONSIBILITIES Local Elected Officials (LEO) Roles and Responsibilities Select the Chief Local Elected Official (CLEO) Assume liability for Workforce Innovation and Opportunity Act (WIOA) program funds Appoint the Local Workforce Development Board (LWDB) members Approve the LWDB-developed WIOA budget 4
ROLES AND RESPONSIBILITIES CLEO/Board Joint Roles and Responsibilities Develop/submit the local WIOA plan Conduct oversight and monitoring of the One-Stop system, Youth Activities and Employment and Training Activities Set policy for WIOA activities and services consistent with state and federal policies Select One-Stop Operators Negotiate and reach agreement on local performance measures Respond to monitoring findings 5
PRIMARY INDICATORS OF PERFORMANCE WIOA establishes performance indicators and reporting requirements to assess the States and local areas effectiveness in serving individuals participating in the workforce development system. Indicator s displayed consist of: 3 Adult Indicators 3 Dislocated Worker Indicators 2 Youth Indicators 3 Wagner-Peyser Indicators 6
WIOA PRIMARY INDICATORS OF PERFORMANCE LWDB 03 PY 2017 Actual Performance PY 2017 Performance Targets PY 2017 Achievement Level PY 2018 Performance Targets Program Year (PY) 2017 July 1, 2017 June 30, 2018 Adults: Employment Rate 2nd Quarter After Exit Employment Rate 4th Quarter After Exit Median Earnings 2nd Quarter After Exit Credential Attainment * Dislocated Workers: Employment Rate 2nd Quarter After Exit Employment Rate 4th Quarter After Exit Median Earnings 2nd Quarter After Exit Credential Attainment * Youth Common Measures: Education and Employment Rate 2nd Quarter After Exit 100.00% 94.70% $7,304 94.70% 80.00% 82.00% $6,500 N/A 125.00 115.49 112.37 N/A 85.00% 82.50% $6,850 82.00% 83.00% 60.00% $7,000 85.00% 100.00% 100.00% $11,495 100.00% 75.00% 79.00% $6,850 N/A 133.33% 126.58% 167.81% N/A 96.60% 65.00% 148.62% 75.00% Education and Employment Rate 4th Quarter After Exit 77.80% 60.00% 129.67% 60.00% Credential Attainment * Wagner-Peyser: Employment Rate 2nd Quarter After Exit 88.90% N/A N/A 77.00% 67.80% 64.00% 105.94% 62.00% Employment Rate 4th Quarter After Exit 67.70% 64.00% 105.78% 64.00% Median Earnings 2nd Quarter After Exit $4,271 $4,850.00 88.06% $4,400.00 Not Met (less than 90% of target) Met (90-100% of negotiated) Exceeded (greater than 100% of negotiated) 7
PROGRAMMATIC MONITORING ACTIVITY Federal law requires the state to develop an oversight system to monitor all workforce programs receiving federal funds. DEO, in consultation with CareerSource Florida, annually develops and implements a process for monitoring LWDBs. Corrective Action Plans to address all findings are required. Programmatic and financial monitoring is completed annually. 8
PROGRAMYEAR 2017 SUMMARY OF LOCAL FINDINGS PY 2016 Findings PY 2017 Findings Program 2 5 Welfare Transition Wagner-Peyser (RESEA, MSFW, Career Center Credentialing, MIS) Supplemental Nutrition Assistance Program - Employment and Training WIOA Adult / Dislocated Worker / Youth 1 1 1 0 1 0 N/A N/A Trade Adjustment Assistance Act 5 6 Total Findings 9
FISCAL YEAR 2017 SUMMARY OF THE RESULTS OF FINANCIAL MONITORING (LWDB 03) Categories Results None Findings None Issues of Non-Compliance 1 Observations None Technical Assistance 10
PROGRAM YEAR 2018 TOTAL STATEWIDE FUNDING $6,139,942 3% $1,359,815 1% $10,142,480 5% Workforce Innovation and Opportunity Act $1,000,000 1% $27,016,202 12% Welfare Transition Wagner Peyser Veterans $133,143,442 $52,514,907 24% 54% Supplemental Nutrition Assistance Program Trade Adjustment Assistance Program Reemployment Assistance State Total: $231,555,639 11
PROGRAM YEAR 2018 TOTAL LOCAL AMOUNT $54,437 4% $0 0% $101,328 6% $3,530 0% $114,022 7% Workforce Innovation and Opportunity Act Welfare Transition Wagner Peyser $317,494 20% Veterans $1,006,792 63% Supplemental Nutrition Assistance Program Trade Adjustment Assistance Program Reemployment Assistance Local Total: $1,597,603 12
PROGRAM YEAR 2017 DIRECT CLIENT SERVICES & ADMINISTRATIVE EXPENDITURES 90% Out of a total of $1,648,747 in workforce expenditures last year, $171,685 was spent on administration by the local board. 10% Direct Client Services Administrative Expenditures 13
PROGRAM YEAR 2017 ITA EXPENDITURE REQUIREMENT 15% 15.81% Annual ITA Expenditure Requirement ITA Expenditures 14
PROGRAM YEAR 2016 & 2017 WIOA WE REQUIREMENT * WIOA Youth Requirement: 20% Work Experience 13.45% 1.98% PY2016 PY2017 15
PY 2017 PERCENTAGE OF EXPENDITURES ON OUT-OF-SCHOOL YOUTH 7,531.97 3% Out-of-School *WIOA Requirement: 75% Out-of-School 210,781.31 97% In-School 16
WORKFORCE TRENDS Apprenticeships Nationwide employers have hired over 411,000 apprentices since January 1, 2017. Gig Economy 55 million people in U.S. are gig workers, more than 35% of the U.S. workforce and that number is projected to increase to 43% by 2020. Soft Skills According to a 2018 Workplace Learning Report by LinkedIn, employers have identified soft skills as their top training priority. 17
QUESTIONS 18
ADDITIONAL INFORMATION For more information, please contact: Casey Penn Florida Department of Economic Opportunity One-Stop and Program Support (850) 245-7485 Casey.Penn@deo.myflorida.com 19