Fluid Components in Experimental Bioreactor Study
Explore the analysis of fluid components in a bioreactor study through GSS spreadsheets, scatter data visualization, and overlay of multiple datasheets for comprehensive insights. Enhance your understanding of substrates and reaction products over time.

Download Presentation

Please find below an Image/Link to download the presentation.
The content on the website is provided AS IS for your information and personal use only. It may not be sold, licensed, or shared on other websites without obtaining consent from the author. If you encounter any issues during the download, it is possible that the publisher has removed the file from their server.
You are allowed to download the files provided on this website for personal or commercial use, subject to the condition that they are used lawfully. All files are the property of their respective owners.
The content on the website is provided AS IS for your information and personal use only. It may not be sold, licensed, or shared on other websites without obtaining consent from the author.
E N D
Presentation Transcript
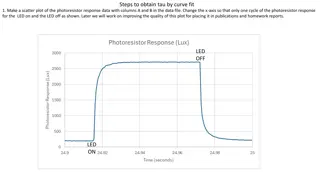
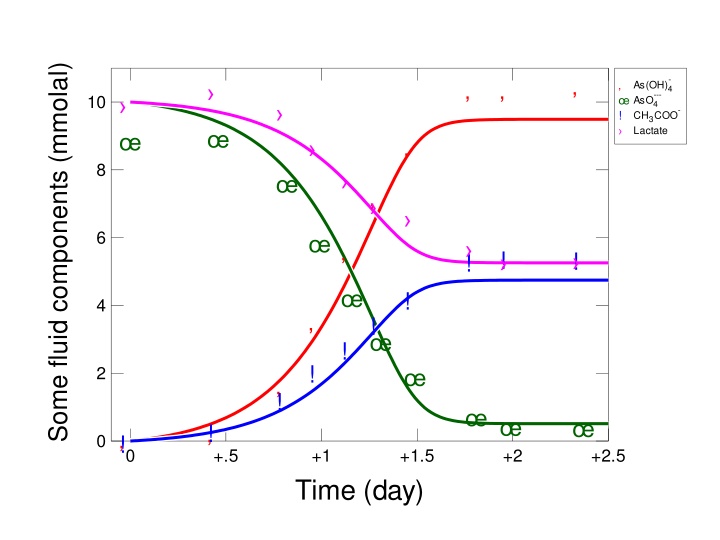
Some fluid components (mmolal) - AsO4 ! Lactate As(OH)4 --- 10 CH3COO- 8 6 ! ! ! ! 4 ! ! ! 2 ! ! ! 0 0 +.5 +1 +1.5 +2 +2.5 Time (day)
Start by making a GSS spreadsheet with the experimental data You can set the marker color, size, and shape for analytes or samples. Spreadsheet contains concentrations of substrates and reaction products sampled over time from a bioreactor.
Left-drag the .gss file onto your plot... or, go to File Open Scatter Data and browse to the .gss file.
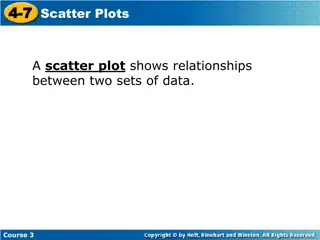
Scatter data can be added to Gtplot, P2plot, Xtplot, Act2, and Tact plots.
Format GSS Data Turn scatter data on or off, and choose marker symbol, color, and size by analyte or by sample We ve set distinct marker colors for each analyte in this example. Include sample labels or legends and add connecting lines.
You can overlay multiple GSS datasheets on Act2 and Tact plots Format Scatter Data Two GSS files are loaded into Act2
")