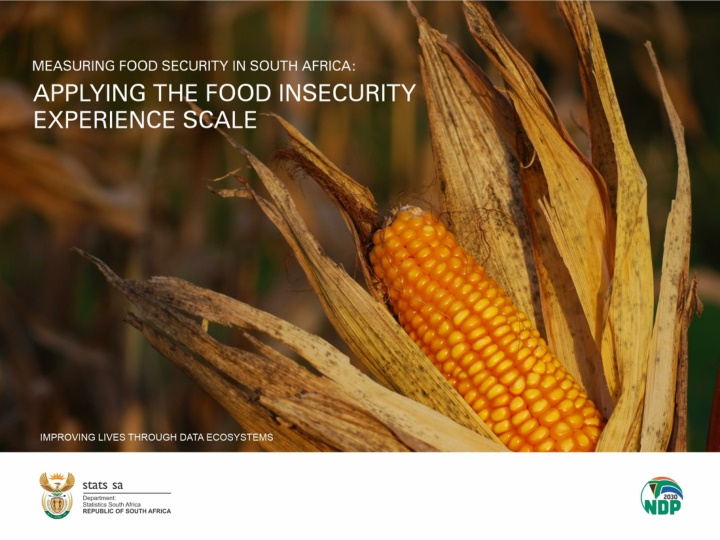
Food Insecurity in South Africa: Factors and Solutions
The report delves into the state of food insecurity in South Africa, using the Food Insecurity Experience Scale results. It explores factors contributing to food insecurity, such as employment status, household income sources, and involvement in agriculture. The findings shed light on the prevalence of moderate to severe food insecurity in South Africa and highlight the importance of addressing key challenges to improve food security in the region.

Download Presentation

Please find below an Image/Link to download the presentation.
The content on the website is provided AS IS for your information and personal use only. It may not be sold, licensed, or shared on other websites without obtaining consent from the author.If you encounter any issues during the download, it is possible that the publisher has removed the file from their server.
You are allowed to download the files provided on this website for personal or commercial use, subject to the condition that they are used lawfully. All files are the property of their respective owners.
The content on the website is provided AS IS for your information and personal use only. It may not be sold, licensed, or shared on other websites without obtaining consent from the author.
E N D
Presentation Transcript
Content of the report Chapter 1: Background State of food security in the world Factors affecting food security in South Africa Chapter 2: Purpose of the report To present the state of food insecurity in south Africa using Food Insecurity Experience Scale results Chapter 3: Methodology (FIES) and sources Chapter 4: FIES results South Africa s prevalence of moderate to severe and severe food insecurity Chapter 5: Factors contributing to food insecurity Employment status within south African households Households sources of income Households involvement in agriculture Chapter 6: Summary of the findings and conclusion 2
State of food security in the world People facing hunger in the world increased by 161 million in 2020 from 720 million in 2019 to 881 million in 2020 (FAO et al 2021) 2,37 billion people globally did not have adequate access to food in 2020, increase of 320 million from 2019. Contributing factors: Lockdown triggered by Covid-19 pandemic Disruption in food supply Loss of livelihoods and income General a world economic slowdown
Definition of food security Food security exists when all people at all times, have physical and economic access to sufficient, safe and nutritious food that meets their dietary needs and food preferences for an active and healthy life (World food summit, 1996) There are four pillars of food security: Availability, Accessibility, Utilization and Stability Statistics South Africa uses the Household Food Insecurity Access Scale (HFIAS) and Food Insecurity Experience Scale (FIES) to determine the prevalence of food insecurity at individual and household levels. 4
Food security is a key concern The National Development Plan (NDP) puts food and nutrition security high on the country s developmental agenda with Department of Agriculture, Land Reform and Rural Development (DALRRD) as a custodian of food security implementation plan. The NDP recognizes agricultural productivity, rural development, job creation , poverty reduction and economic growth as part of addressing food security. 5
Factors affecting food security South Africa faces a wide spectrum of challenges that include high levels of poverty, unemployment, income inequality, climate change (i.e. drought),unstable household food production and past spatial and regulatory imbalances. Poverty stricken households lack money to buy food. These households are constrained by the inability to secure employment or to generate income. Poor households are typically characterised by few income- earners and many dependents, and are particularly vulnerable to economic shocks. 6
Methodology used in this report The Food Insecurity Experience Scale (FIES) was used to estimate the prevalence of moderate to severe and severe food insecurity in the population. Respondents are asked 8 about access to food to provide the estimates. Respondents are asked about Uncertainty and anxiety about ones ability to access food quality of food: changes in diet; eating a less balance or a repetitive diet Decrease in quantity of food or skipping of some meals Feeling hungry and not even eating for the whole-day because lack of money or other resources to obtain food.
FIES Questions Q1. You were worried you would run out of food because of a lack of money or other resources? Q2. You were unable to eat healthy and nutritious food because of a lack of money or other resources? Q3. You ate only a few kinds of foods because of a lack of money or other resources? Q4. You had to skip a meal because there was not enough money or other resources to get food? Q5. You ate less than you thought you should because of a lack of money or other resources? Q6. Your household ran out of food because of a lack of money or other resources? Q7. You were hungry but did not eat because there was not enough money or other resources for food? Q8. You went without eating for a whole day because of a lack of money or other re
Interpretation of results FAO derived two indicators from the FIES questions Prevalence of moderate to severe food insecurity Prevalence of severe food insecurity Moderate food insecurity: People experiencing moderate food insecurity face uncertainty about their abilities to obtain food, have been forced to compromise on the quality and/or quantity of the food they consume Severe Food Insecurity: People experiencing severe food insecurity have typically run out of food and, at worst, gone a day (or days) without eating
Food insecurity severity levels measured by the FIES in SDG indicator 2.1.2 Food Security Moderate Food Insecurity Severe Food Insecurity
Food insecurity measured along a continuum of severity Moderate food insecurity Severe food insecurity Anxiety about ability to procure adequate food Compromising quality and variety of food Reducing quantities, skipping meals Experiencing hunger Courtesy (FAO, 2016)
Importance of the Food insecurity indicator (FIES) FIES is an SDG monitoring indicator for ending hunger and improving access to food (target 2.1.2) It is used for global monitoring of progress towards the Sustainable Development Goals (SDGs) It allows for cross-country comparisons
The proportion of the population affected by moderate food insecurity plus the population classified as severely food insecure was 17,28% (10,1 million) in South Africa in 2019. The population classified with severe food insecurity was 7% (4,1 million). The female population is the worst affected by both moderate to severe food insecurity and severe food insecurity compared to males. . 25 19.69 20 17.28 15.19 15 10 7.85 7 6.17 5 0 Female Male RSA Moderate to severe (FImod+sev) Severe (FIsev)
People residing in rural areas (farms and traditional areas) were the worst affected by the prevalence of moderate to severe and severe food insecurity.
Almost one in every five black Africans was affected by the prevalence of moderate to severe food insecurity, closely followed by coloureds with 16,14% in 2019. Indians/Asians and whites were least affected. 25 20 19.06 17.28 16.14 15 10 7.75 7 6.59 5 2.46 2.3 1.13 0.43 0 Black African Coloured Indian/Asian White RSA Moderate to severe (FImod+sev) Severe (FIsev)
The population residing in Northern Cape (28,8%), North West (28%), Free State (24,7%) and Mpumalanga (22%) were the provinces most affected by food insecurity in 2019 as their figures were far above the national average.
It is clear from the table that as a consequence of COVID-19, all the provinces were negatively affected by a rise in food insecurity prevalence rates in general. However, Northern Cape, and Eastern Cape were less impacted by moderate to severe food insecurity and severe food insecurity compared to the other provinces in 2020. Limpopo (28,9%) and Kwazulu-Natal (26,4%), on the other hand were some of the provinces that were worst affected by moderate to severe food insecurity prevalence rates in 2020. Global monitoring 2020 (FAO) Province Moderate to severe (FImod+sev) Severe (FIsev) Western Cape Eastern Cape Northern Cape Free State KwaZulu-Natal North West Gauteng Mpumalanga Limpopo South Africa 21,4 ( 4,5) 16,6 ( 5,5) 17,6 ( 5,1) 21,8 ( 4,3) 26,4 ( 2,1) 21,7 ( 6,3) 24,5 ( 3,1) 23,5 ( 5,6) 28,9 ( 2,7) 23,6 ( 1.8) 13,7 ( 3,5) 10,2 ( 4,6) 9,7 ( 3,8) 13,0 ( 3,5) 16,4 ( 4,6) 12,9 ( 4,9) 16,6 ( 2,6) 14,3 ( 4,7) 18,2 ( 5,0) 14,9 ( 1,5)
Factors that contribute to food insecurity Some of the factors that may influence food insecurity Employment status Sources of income The ability to produce food (Household s involvement in agricultural activities)
In 2020, Gauteng (75,7%) and Western Cape (76,0%) were the two provinces with highest proportion of households with at least one member who is employed, On the contrary, Limpopo (52,2%) and Eastern Cape (52,7%) had the least proportion of households with an employed household member.
The figure indicates that unemployment is high and has been increasing in South Africa, as employment was decreasing between 2017 and 2020 both at national and provincial levels. Limpopo (47,8%), Eastern Cape (47,3%), Free State (45,3%) and North West (43%) had the highest proportion of households without an employed person. Gauteng (24,3%) and Western Cape (24%) were the only provinces below the national average the national average of 34.1%.
Rural areas were most affected by unemployment compared to urban areas in the 4 years.
Black African-headed households, followed by white-headed households represented the lowest proportion of households that had at least one person employed. Indian/Asian households had the highest proportion of households with at least one employed person in all four years. 2017 2018 2019 2020 Population group Employed Unemployed Employed Unemployed Employed Unemployed Employed Unemployed Black African 70,6 29,4 70,6 29,4 67,6 32,4 63,4 36,6 Coloured 80,9 19,1 78,3 21,7 80,0 20,0 75,6 24,4 Indian/Asian 83,1 16,9 79,7 20,3 87,0 13,0 83,2 16,8 White 76,9 23,1 76,9 23,1 74,5 25,5 76,0 24,0 South Africa 72,2 27,8 71,9 28,1 69,6 30,4 65,9 34,1
Female-headed households were the worst affected by unemployment, as almost half of them did not have an employed person living in the household in 2020. Male-headed households fared better than their female counterparts. However, both female- and male-headed households experienced an increase in the proportion of households without employed persons from 2017 to 2020.
Households that had salaried individuals as their source of income had declined by almost 8 percentage points in South Africa from 2017 to 2020, while those receiving grants have increased. Those households that received income from businesses had been stable, while those receiving remittances had decreased.
There has always been a gap between female-headed households and those headed by men with regard to income. Female-headed households are always seen as poorer households compared to those headed by males. However, this gap narrowed slightly in 2019 as both female- and male-headed households experienced a decline in income over the four years. A higher proportion of female-headed households received grants as source of income compared to their male counterparts
The figure shows that there has been a decrease in income from salaries, while income from social grants increased in households headed by black Africans in the four years.
The same observation about diminished income from salaries and an increase in grants recipients is also evident among coloured-headed households. Fewer coloured-headed households receive income from remittances compared to black African-headed households.
With the exception of Indian/Asian-headed households, the proportion of households receiving income grants have increased for those headed by black Africans, coloureds and whites. A significant proportion of white-headed households experienced a decline in income from business and an increase in social grants in 2020
Unlike the other population groups the proportion of Indian/Asian-headed households receiving grants as a source of income has been stable for the four years under review. Households headed by Indians/Asians and whites both experienced a decline in income from business between 2019 and 2020
Households involvement in agricultural activities.
Households involved in food production have been below 20% in the four years under review. There was a slight increase in the proportion of households that were producing their food in 2020
Female-headed households represent the highest proportion of households that were taking part in food production compared to male-headed households. It is important to note that in 2020, the gap between female- and male-headed households that were involved in agricultural activities had significantly narrowed.
Provinces with large rural areas have the highest percentage of households involved in agricultural-related activities. Eastern Cape, Limpopo and Mpumalanga have had at least 25% of households producing food since 2017. National figures indicate that there has been a general increase in the percentage of households that were producing their own food in 2020.
Households that reported salaries and grants as their main source of income were mainly involved in agricultural production of food. Households that reported grants as their main source and also involved in agricultural activities peaked in 2019 and 2020.
The Figure indicates that between 2017 and 2020, of the more than 75% of households that were involved in food production, reported that they were doing it to supplement food for the household.
Key findings In 2019, 17,3% of South Africans were estimated to be suffering from moderate to severe food insecurity, while 7,0% were estimated to be affected by severe food insecurity. The provinces worst affected by moderate to severe food insecurity and severe food insecurity were the Northern Cape (28,8% and 15,4%) and North West (28,0% and 11,4%). One out of five South Africans (23,6%) in September 2020 were affected by moderate to severe food insecurity, while almost 14,9% experienced severe food insecurity. The female population is more likely to be both affected by moderate to severe and severe food insecurity compared to their male counterparts. Black Africans followed by coloureds are still more prone to be affected by moderate to severe and severe food insecurity than Indians/Asians and whites.
Key findings continued Almost half of female-headed households did not have an employed person living in the household in 2020. Income from salaries as a source of income has declined, while more households reported receiving an income from grants between 2017 and 2020. Households involved in food production have been below 20% in the four years under review. Female-headed households are mostly producing their own food compared to male-headed households.
Conclusion Many countries have effectively reduced the prevalence of food insecurity by increasing income, economic growth and also offering additional resources to improve food security (FAO, IFAD & WFP, 2014). South Africa will struggle to reduce food insecurity due to the country s high unemployment levels and stagnant economic growth.


")

, North West")


 and Western Cape (76,0%) were the")