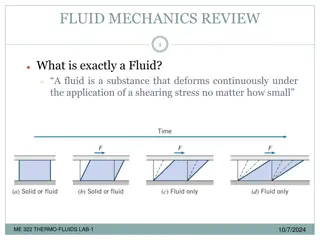
Force Considerations in Fluid Mechanics for Engineers
force considerations in fluid mechanics is crucial for engineers. This content delves into submerged bodies, pressure forces, and calculations for various scenarios like horizontal and inclined plane surfaces in highway and transportation engineering.

Download Presentation

Please find below an Image/Link to download the presentation.
The content on the website is provided AS IS for your information and personal use only. It may not be sold, licensed, or shared on other websites without obtaining consent from the author.If you encounter any issues during the download, it is possible that the publisher has removed the file from their server.
You are allowed to download the files provided on this website for personal or commercial use, subject to the condition that they are used lawfully. All files are the property of their respective owners.
The content on the website is provided AS IS for your information and personal use only. It may not be sold, licensed, or shared on other websites without obtaining consent from the author.
E N D
Presentation Transcript
Beyond GWAS Erik Fransen
Missing heritability Rare variants Common variants of smaller effect Structural variants Gene-gene interactions Inflated heritability 2
Missing heritability Rare variants Common variants of smaller effect Structural variants Gene-gene interactions Inflated heritability 3
Common and rare variants Traditional GWAS identify common variants - MAF > 0.05 - Low-frequency (LF) variants : poorly covered on chip Low LD with SNPs on chip Next-generation sequencing (NGS) techniques to identify LF variants in large cohorts 5
Testing LF variants Do LF variants contribute to complex traits? - LF variants with large effect? - Multiple rare variants in 1 gene? - Missing heritability? Testing association - Classic testing - Gene-based testing 6
Classic association test Test association between single variant and disease - Chisquare test AA Aa aa Total 1000 1000 Case Control 7
Classic association test Test association between single variant and disease - Chisquare test : common variant AA 560 640 Aa 380 320 aa 60 40 Total 1000 1000 Case Control 8
Classic association test Test association between single variant and disease - Chisquare test : rare variant AA 987 991 Aa 12 9 aa 1 0 Total 1000 1000 Case Control - Test not valid, or low power, unless high N - GWAS : MAF<0.05 = problem 9
Collapsing rare variants Collapsed genotype : - Gene-by-gene recoding genotype Any rare variant present or not (yes/no) - Associate collapsed GT with phenotype No rare variant At least 1 rare variant 150 111 Total Case Control 850 889 1000 1000 10
Burden test Test the burden of rare variants: - Count #rare variants within each gene - Associate #variants with phenotype 11
Problem with burden tests Collapsing & burden test assume all rare alleles act in one direction - Assume deleterious effect - Ignore neutral/beneficial alleles - Controls may be enriched in beneficial variants 12
Non-burden test Effects of rare alleles represent a distribution - Beneficial and deleterious alleles 13
Non-burden test Sequence Kernel Association Test (SKAT) Estimate allelic effect sizes for all SNPs - Compare distribution of effects between cases and controls - Collective effect of all SNPs per gene 14
Recent results on rare variants Require combination of : - GWAS data - Whole exome/targeted resequencing/whole genome sequencing Often - Exome sequencing form GWAS cohorts - Targeted resequencing of previous GWAS hits N : 5,000 10,000 15
Study1 : Amino acid levels 9 phenotypes = levels of 9 AA - Risk factors for (ao.) T2D, Alzheimers) - Exome sequencing on 8,800 ID + GWAS data Single-marker test: - 17 associations G-W significant at 12 loci - 3 novel loci 16
Study1 : Amino acid levels 9 phenotypes = levels of 9 AA - Risk factors for (ao.) T2D, Alzheimers) - Exome sequencing on 8,800 ID + GWAS data Single-marker test Gene-based (SKAT) test - 1 additional gene - p=9E-8 on aggregated effect of all variants - most sig. single SNP:10E-5 17
Study1 : Amino acid levels 9 phenotypes = levels of 9 AA - Risk factors for (ao.) T2D, Alzheimers) - Exome sequencing on 8,800 ID + GWAS data Single-marker test Gene-based (SKAT) test Missing heritability? - Common variants (GWAS) : 6% - Plus rare variants (exome) : 15-20% 18
Study 2 : Type2 diabetes Meta-analysis of 23k cases and 40k controls Combine: - (old) GWAS data - Whole exome resequencing (50x depth) - Whole genome resequencing (4x depth) 19
Study 2 : Type2 diabetes Meta-analysis of 23k cases and 40k controls Combine: Results: - 175K LF variants identified - No LF variants were genome-wide significant - Only one highly sig. LF variants in previously unidentified gene - SKAT (of LF variants): no genome-wide sig. genes no LF variants with high effect in T2D 20
Study 2 : Type2 diabetes Meta-analysis of 23k cases and 40k controls Combine: Results: no LF variants with high effect in T2D LF variants in previously known loci LF variants underly old GWAS signal Old GWAS hit often due to >1 LF variant better pinpointing causal variant 21
Conclusion LF variants Most, but not all, LF analyses point to loci/genes previously identified by GWAS LF variants with large effect size : not found (yet?) LF variants may explain part of missing heritability, but not all 22
Missing heritability Rare variants Common variants of smaller effect Structural variants Gene-gene interactions Inflated heritability 23
Heritability in common variants GWAS results on human adult height - N = 34,000 20 loci associated - N = 180,000 180 loci associated All associated SNPs account for 10% of phenotypic variation 24
Heritability in common variants GWAS results on human adult height - N = 34,000 20 loci associated - N = 180,000 180 loci associated - N= 400,000 460 loci All associated SNPs account for 20% of phenotypic variation - SNPs with p<5.0E-8 25
Common SNPs for height Missing heritability in common SNPs ? - SNPs not reaching genome-wide significance - Causal variants not in complete LD with typed SNPs 27
Common SNPs for height Missing heritability in common SNPs ? - SNPs not reaching genome-wide significance - Causal variants not in complete LD with typed SNPs Effect of all SNPs together: - No individual SNPs pinpointed - Aggregated effect of all SNPs - 45% < H 28
Common SNPs for height Missing heritability in common SNPs ? - SNPs not reaching genome-wide significance - Causal variants not in complete LD with typed SNPs Correct for incomplete LD : - Correction depends on MAF of causal SNPs - MAF ~ typed SNPs : 54% - MAF lower : 80% 29
Conclusion Typed SNPs can explain over 50% of H - Remainder : incomplete LD and (compatible with) lower MAF Larger GWAS can identify more SNPs - P lowers as N increases - Deep resequencing will identify more causal variants 30
Psychiatric disorders (Almost) no major genes identified How much variance is explained by non- significant SNPs ? - GWAS in schizophrenia - Select SNPs using varying cutoff p<0.1 ; p<0.2 ; p<0.3 ; p<0.4 ; p<0.5 - Build regression model using included SNPs - Use regression model to predict disease status in independent populations 32
Conclusion Low-significant SNPs enriched for causal alleles - SNPs (for schizophrenia) with low significance can predict disease status (for schizophrenia) in independent population - Schizophrenia SNPs also predicting bipolar disorder 40
Future prospect Prediction model built using SNPs from GWAS Higher sample size : SNPs with p<< more enriched of truly causative SNPs Prediction model becomes more accurate Polygenic risk score may become diagnostic tool to predict phenotype (even in absence of individually pinpointed SNPs) 41