Foreign Economic Trends and Sanctions in Russia
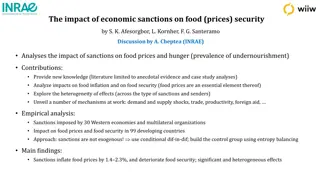
This data provides insights into the macroeconomic indicators in Russia with a focus on foreign economic trends, outcomes, and forecasts by Alexander Knobel. It includes short- and medium-term forecasts for the global economy, international trade trends, challenges, and sanctions against Russia by key global players in 2022 and 2023.
Download Presentation

Please find below an Image/Link to download the presentation.
The content on the website is provided AS IS for your information and personal use only. It may not be sold, licensed, or shared on other websites without obtaining consent from the author. If you encounter any issues during the download, it is possible that the publisher has removed the file from their server.
You are allowed to download the files provided on this website for personal or commercial use, subject to the condition that they are used lawfully. All files are the property of their respective owners.
The content on the website is provided AS IS for your information and personal use only. It may not be sold, licensed, or shared on other websites without obtaining consent from the author.
E N D
Presentation Transcript
Macroeconomic indicators in Russia: Foreign Economic Trends, Outcomes and Forecasts Alexander Knobel Head of International Trade Departament
Short- and medium-term forecasts for the global economy 2 The world GDP and trade volume growth rates in 2022-2028 (according to the IMF, % of the previous year) New forecasts for global growth in 2023-2024 6.0 3.5 5.1 3.0 2.9 2.9 5.0 3.0 2.7 2.4 3.7 3.6 4.0 3.5 3.5 3.5 2.5 3.4 2.1 3.2 3.2 3.1 3.1 3.0 2.9 3.0 2.0 2023 2.0 1.5 2024 0.9 1.0 1.0 0.5 0.0 2022 2023 Gross domestic product, constant prices Trade volume of goods and services 2024 2025 2026 2027 2028 0.0 IMF World Bank OECD Global economic conditions have improved but merchandise trade continued to slow The IMF expects global growth of about 3% in 2023-2024. According to the World Bank forecast, economic growth in the world will slow down to 2.1% in 2023 forecast but in 2024 output is expected to rise to 2.4%. The latest OECD s Economic Outlook predicts global GDP will grow 2.7% in 2023 , with a modest improvement of 2.9% in 2024. Sources: IMF, World Bank, OECD. 2023
3International trade: fundamental trends and recent factors Growth of non-tariff trade restrictions Paralysis of the WTO and multilateral trade system Trade wars Digitalization of global economy and trade Comprehensive focus on sustainable development and climate change agenda Geopolitical crisis in Europe More incentives for deglobalization and further fragmentation of trade 2021 2022 2024 2019 2018 2020 2023 Challenges for global supply chains functioning and international cooperation during COVID-19 pandemic New wave of trade restrictions to tackle pandemic disbalances II. New aspects for regulation and negotiations but contradictions as well I. Growth of protectionism, deglobalization III. GVCs reconfiguration, reorientation of the global trade flows and cooperation chains 2023 3
4 Sanctions against Russia 4 In 2022 Russia became the world leader in terms of the number and scope of sanctions restrictions imposed Initiators of sanctions contribute 60% of global GDP: EU, US, UK, Japan, Canada, South Korea and others Financial sector: blocked CBR reserves, assets and activities of Russian banks, banks disconnected from SWIFT, restrictions from international payment systems Key risks of reorientation of foreign economic activities arise from secondary sanctions. Trade: cancelled MFN, restrictions on exports to Russia (dual-use goods, high-tech products, including electronics and components), embargo on imports (fuels, key exports) In 2023 focus of the US, the EU and G7 countries lies on the mechanisms to prevent sanctions circumvention Energy: ban on supplies of technology and equipment for the development of oil refineries, price cap USA: the most developed regulation of secondary sanctions (about 100 companies from neutral countries are under secondary sanctions against Russia). Transport: airspace of 37 countries closed, ban on supplies of aircraft, equipment and spare parts, maintenance, US, EU, UK and Canadian seaports closed, ban on road transport operators EU: regulatory tools are being developed, lists of goods and countries that will be subject to trade restrictions are under consideration. Private sector: many foreign companies suspended operations in Russia or decided to withdraw from the market (more than 1,000 companies, mostly global corporations). Individual sanctions, restrictions in the sphere of sports, culture and recreation 2023
Current macroeconomic indicators 5 The current account is determined mostly by the value of goods exports, which depend significantly on global prices Russia s balance of payments went into negative area in June 2023 for the first time since 2020, with a current account deficit of $1.4 billion On the basis of 1-3 quarters of 2023, the current account surplus fell due to a reduced surplus in foreign trade In 2023 Q1-Q3, budget revenues also were around the same level of the previous year Increase in expenses significantly exceeds the average inflation level in Russia The government budget deficit hit 1.0% of GDP Indicators (in trillion rubles) Q1-Q3 2021 Q1-Q3 2022 Q1-Q3 2023 2023 to 2021 2023 to 2022 Q1-Q3 2021 Q1-Q3 2022 Q1-Q3 2023 Indicators (in billion $) Current account Trade balance Export Import Balance of services Export Import 75,2 121,7 340,3 218,6 -14 38,6 52,6 195,9 252,7 448,1 195,3 -14,1 36,4 50,4 40,9 87,8 314,7 226,8 -24,8 30,3 55,1 Revenues 17,92 19,74 19,73 10,1% 0,03% Oil and gas 6,18 8,51 5,58 9,9% 34,5% Non-oil and gas 11,74 11,23 14,16 20,6% 26,0% Expenses 16,48 19,54 21,43 30,1% 9,7% Surplus/deficit Inflation (%, from 1st January) 1,44 0,20 1,7 3,14 1,9 Balance of primary and secondary income 5,3 10,7 5,5 .. .. -32,7 -42,6 -22,1 Sources: Bank of Russia, Ministry of Finance of RF 2023
6 Results of 2022 and factors for further economic development In 2022, the Rosstat recorded a decline in Russia s GDP of 2.1%. Russian economy contracted by 1.8% YoY in Q1 2023 and grew by 4.9% YoY in Q2 2023. As a result, it made possible to achieve positive growth in 1H 2023 (+1.6% YoY). Growth rates of the main macroeconomic indicators of Russia in % YoY The current inflation picture is changing radically, as a number of pro-inflationary factors are gaining strength, such as an increase in household incomes and a lower savings ratio, a significant strengthening of the USD against the ruble, and a large-scale increasing budget spending. In our view, inflation will get higher by the end of the year, to ~8%. Inflation 1 2023 +1,6 3,7* Indicator 2022 Sanctions resulted in significant damage to the investment climate. State and the state corporations become the major source of investment. The peak decline in investment activity Russian economy is experiencing nowadays, in 2023. Further recovery will be dependent on a number of factors, such as interest rates on loans, corporate profits, rebound in investment import, etc. 2,1 11,94 GDP Investments Consumer Price Index Investments in fixed assets Real disposable personal income +4,6 +7,6 Real disposable income of the population decreased in 2022. However, income from work occupies a large share in the income structure of the population. Due to the labor shortage in the domestic market, employers are increasing wages at a rate exceeding current inflation. Acceleration of inflation in the second half of 2023 and increased tax and administrative pressure are leading to a slowdown in the recovery of real disposable income of the population this year. Real incomes of the population 1,0 +4,7 6,5 +2,4** Retail turnover Retail turnover decreased by 6.5% in 2022, which is primarily due to decreased demand, as well as to some extent to a supply shortage. In the first 7 months of this year, retail trade turnover increased by 2.4% in real terms. Lower inflation, goods imports and household incomes recovery, the low-base effect of the previous year are anticipated to boost activity in retail. For reference: Retail Unemployment rate (according to ILO), % of EAN 3,9 3,0*** At the end of 2022, the unemployment rate dropped to 3.9%. The downward trend continues. At the end of August 2023, the unemployment rate fell to 3.0%, which may indicate a possible labor shortage in some areas. Notes: * August 2023 to December 2022 ** January-July 2023 to January-July 2022 *** August 2023 Unemployment 2023
Macroeconomic forecasts 7 GDP, industrial production, retail trade turnover, real incomes and wages move to growth this year Inflation will return to target level by the end of 2024 The level of 2021 in key indicators will be surpassed in 2024 Indicators 2020 2,7 2021 +5,6 2022 2,1 2023 +2,0 2024 +1,3 2025 +1,7 2026 +1,8 Real GDP 135,3 107,7 153,4 172 185 201 218 Nominal GDP, trillion rubles 4,9 8,0 11,94 Consumer price index 7 8 4 4 4 1,4 +7,7 +4,0 +3,2 +1,2 +1,6 +1,9 Investments in fixed assets 2,6 +5,3 0,6 +1,6 +1,5 +1,8 +1,7 Industrial production 3,5 +3,0 1,0 +3,1 +1,8 +2,0 +1,9 Real disposable income of the population 4,1 +7,3 6,7 +3,2 +1,4 +1,8 +1,7 Retail turnover +3,8 +2,9 1,2 +5,5 +2,4 +2,2 +2,0 Real wages 2023
8Chinas role in trade reorientation in 202223 Increased trade with China in 2022 2023 The reorientation of imports to neutral countries mainly completed by the end of 2022, exports at the beginning of 2023. The shares of trading partners stabilized in 2023 at new levels: Russian exports to China Russian imports from China 01 10 2023/ 01 10 2022 01 10 2023/ 01 10 2022 HS Group 2022/ 2021 2022/ 2021 the share of neutral countries in January July increased in imports to 73.2% (+10.7 p.p. by 2022 and +24.6 p.p. by 2021), in exports to 77.7% (+26.1 percentage points by 2022 and +33.7 p.p. by 2021) Foodstuff and agricultural products, 01 24 Mineral products, 25 27 Chemical industry products & rubber, 28 40 Raw leather, products, 41 43 Wood, pulp products, 44 49 Textiles and footwear, 50 67 Precious stones and metals, 71 Base metals and products, 72 83 Machinery, equipment and vehicles, 84 87, 89, 90 Other products, 68 70, 90 92, 94 97 Secret commodity groups, aircraft, weapons, SS, 88, 93 Total 43% 52% 39% 4% China plays a key role in redirecting trade, its share in imports increased to 41.6% (+5.3 p. p. by 2022 and +16.9 p.p. by 2021), in exports to 23.9% (+8.8 p.p. by 2022 and +9.3 p.p. by 2021) 75% 6% 53% 11% 56% 11% 62% 11% furs and 29% 34% 22% 2% Major partners in 2023 (by January July 2021): and paper 1% 7% 120% 15% trade with the main unfriendly countries (import and export) decreased: EU ( 46% & 62% ), UK ( 40% & 99,7%), USA ( 63% & 90%), South Korea ( 50% & 16% ), and Japan ( 54% & 40% ) 38% 20% 2% 31% 5% 47% 6% 45% imports from neutral countries have increased: China (+84% ), Turkey (+68%), Belarus (+64%) and Kazakhstan (+68%), weaker from more remote: India (+28%) and Brazil (+21%); exports to neutral non CIS countries have increased: China (+56% ), Turkey (+91%), India ( 6,7 ), weaker in EAEU countries: Belarus (+20%) and Kazakhstan (+6%) 7% 9% 1% 29% 0% 66% 11% 82% 33% 43% 12% 24% 19% 41% 18% 30% +43% +12% +13% +50% 2023
Russia's Foreign Trade Results 2023: China's Role 9 Export 2023: $430 bn ( 27% in value, 8% in volume compared to 2022), including: Import 2023: $274 bn (+8% in value, +1% in volume compared to 2022), including: Non-resource non-energy exports: $155 bn ( 18% in value, +6% in volume compared to 2021, including industrial goods: $114 bn ( 23%) Machinery and equipment: $128 bn ( +19% in value, +16% in volume) From China $115 bn +33% From unfriendly countries $75 bn 17% To unfriendly countries $90 bn 68% To China $109 bn +11% 2023
10 Russian exports to China in 20222023 discounts Discounts made it possible to quickly redirect supplies, but may become a factor constraining their growth 120 30 110 25 Discount on Russian oil: Small deviations in the average price of supplies from Russia and other countries may be caused by irregular flow within a month. 100 20 90 15 USD/bbl There were no systematically stable deviations until April 2022. % 80 10 Since March 2022, Russian oil has been supplied to China at a discount: 70 5 In the summer of 2022 , it reached 15% By the end of 2022 , it decreased to 4-9% 60 0 After the start of the embargo on oil supplies to the EU increased again to 11% in May 2023 50 -5 1 2 3 4 5 6 7 8 9 101112 1 2 3 4 5 6 7 8 9 101112 1 2 3 4 5 6 7 8 9 10 2021 2022 2023 Since June 2023, it has been decreasing in August- October, the discount was on average 4% Discount (%), right axis Price of oil imported from other countries Price of oil imported from Russia The total discount for January-October 2023 amounted to about $3.5 billion 2023
11 Russian Foreign Trade Forecast: 2023-2030 11 2022 2023 2024 2025 2026 2030 Flow $ bn $ bn 2023/22 $ bn 2024/22 $ bn 2025/22 $ bn 2026/22 $ bn 2030/22 Export 590,8 429 27% 435 26% 445 25% 460 22% 590 1% Import 255,2 274 8% 280 9% 285 12% 300 17% 360 40% Export Forecast: Regions: growth South-East Asia, China, India, Middle East, North Africa. The negative trend (-70-100%) is focused on the EU, UK, Ukraine, USA. Reduction for neutral countries: Iran, Mexico, other European countries, etc. Goods: negative trend energy resources (various factors), except for the gradual build-up of LNG; growth - gemstones, metals, food (wheat and barley), railway wagons and equipment, power engineering equipment. Import Forecast: Regions: growth EAEU, Turkey, India, Taiwan, Mexico and Azerbaijan. Reduction of imports is recorded with Ukraine, as well as with Australia, where Russian imports are largely represented by sanctioned goods. Goods: negative trend fertilisers, transport machine equipment (except for land transport), agricultural goods (barley, wheat, oils, dairy products); growth - other non-energy goods, including the main types of machinery and equipment. 2023 11
12 Risks for Russia in New Reality 12 Sanctions are a long-term key factor in Russia's international relations. General sustainability of the Russia`s economy under the pressure of obvious risks According to the main macroeconomic indicators - relative stability in 2022, In 2023: strengthening of negative factors through the reduction of oil and gas export revenues, with a more moderate growth of budget expenditures, the deficit decreased, but still remains Inflation risks are assessed as medium, investment climate and demographic deterioration risks are more significant. Important remaining risk indicators - deterioration of the situation on the main balance of payments indicators, uncertainty on budget expenditures Foreign economic risks challenges for foreign economic reorientation, secondary sanctions (gradual expansion of the US sanctions lists to include companies from neutral countries). 2023
Challenges and Opportunities for Russia in the New Reality 13 13 Reorientation of foreign economic activities, launch and development of new cooperation formats in foreign markets: In the new realit the issues of reorientation to the alternative markets are exceptionally crucial: EAEU and CIS, Asia, Africa, South America. According to the forecasts on foreign trade for the period 2022-2030: the highest growth rates of exports - China, India, Middle East, South-East Asia, other Asian and African countries, imports - India, China, SEA, Middle East, Turkey. Chinese market represents the highest priority in foreign trade: interaction within the GVCs, opportunities for reorientation of external industrial and sevices cooperation. Import dependence is high in many spheres, primarily in non-consumer goods, trade statistics and data on export potential show limited opportunities for reorientation. A new stage of import substitution Opportunities for increasing cooperation with Russia should outweigh the growing risks of secondary sanctions; new formats of technological and financial cooperation independent from unfriendly countries are needed. Key challenges - development of transport and logistics infrastructure to ensure trade reorientation, transition to alternative methods of international payments (including national currencies), ensuring sustainability of foreign economic activity and domestic markets in conditions of external turbulence. 2023


