Fossil Fuel Divestment
Explore the performance of Russell 3000 Index ex-Oil, Gas & Consumable Fuels vs. Russell 3000 Index WTI Crude Oil Spot over a 3-year period. Understand how fossil fuel divestment impacted annualized returns and volatility from 1988 to 2013. Delve into investment policy statement questions, economics of sustainability, and exposure analysis across various sectors.

Download Presentation

Please find below an Image/Link to download the presentation.
The content on the website is provided AS IS for your information and personal use only. It may not be sold, licensed, or shared on other websites without obtaining consent from the author.If you encounter any issues during the download, it is possible that the publisher has removed the file from their server.
You are allowed to download the files provided on this website for personal or commercial use, subject to the condition that they are used lawfully. All files are the property of their respective owners.
The content on the website is provided AS IS for your information and personal use only. It may not be sold, licensed, or shared on other websites without obtaining consent from the author.
E N D
Presentation Transcript
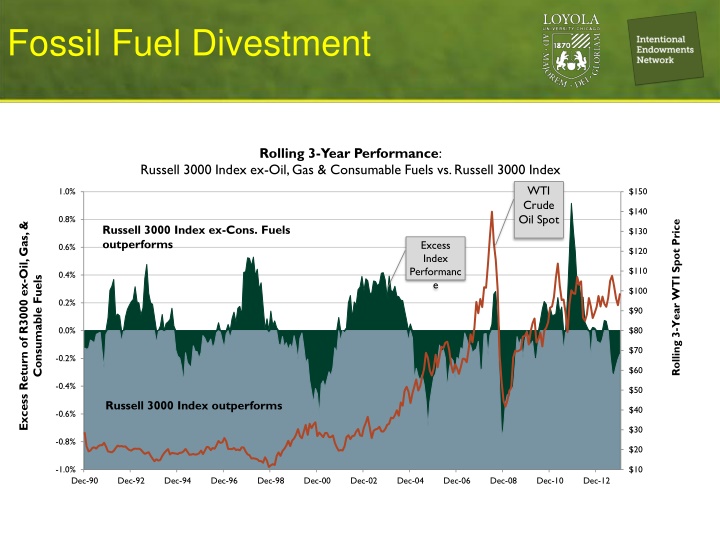
Fossil Fuel Divestment Rolling 3-Year Performance: Russell 3000 Index ex-Oil, Gas & Consumable Fuels vs. Russell 3000 Index WTI Crude Oil Spot 1.0% $150 $140 0.8% Excess Return of R3000 ex-Oil, Gas, & Rolling 3-Year WTI Spot Price Russell 3000 Index ex-Cons. Fuels outperforms $130 Excess Index Performanc e 0.6% $120 $110 0.4% Consumable Fuels $100 0.2% $90 0.0% $80 $70 -0.2% $60 -0.4% $50 Russell 3000 Index outperforms $40 -0.6% $30 -0.8% $20 -1.0% $10 Dec-90 Dec-92 Dec-94 Dec-96 Dec-98 Dec-00 Dec-02 Dec-04 Dec-06 Dec-08 Dec-10 Dec-12
Fossil Fuel Divestment Summary Results for 1988-2013 Period R3000 xOil, Gas & Cons. Fuels R3000 10.63% 10.63% Annualized Returns 14.9% 14.8% Annual Standard Deviation 0.71 0.72 Sharpe Ratio Over the 26-year period from 1988 through 2013, an investor could have invested in the broad U.S. stock market (as measured by the Russell 3000 Index) with or without investment in the oil, gas, and consumable fuels industry and achieved the same 10.63% return with slightly higher volatility. Over shorter-term periods within that time span, an investor would have experienced deviations of up to 80 bps between the three-year trailing period performance of the broad U.S. stock market and the U.S. stock market less the consumable fuels industry.
Investment Policy Statement Questions to Consider What is your entity s mission? Who are all of the stakeholders and how should they be included in the process? Does the entity have mission related guidelines already in place as part of its Investment Policy Statement? Does it adequately reflect the institution s mission? What resources (time and people) can you devote to implementation and what networks can you access for support? Where will efforts be focused in promotion of this mission? SHAREHOLDER ACTIVISM DISCOUNTED LOANS PORTFOLIO & GRANTS GRANTS
Economics of Sustainability Physical Impacts Climate Change Risks Have Many Layers and Create Many Opportunities Risks: property, access to resources, built environment Opportunities: infrastructure, new markets, tech innovation Supply Chain Disruption Risks: food and water systems Opportunities: sustainable ag, water markets Policy and Regulation Response Risks: (un)anticipated change, regional dispersion Opportunities: carbon markets and conservation finance Longer Term Indirect Risks Risks: human health, productivity, geopolitics, fiscal stability Opportunities: essential services, product innovation
Know Your Exposure Example Exposure Summary Alcohol, Gaming, Tobacco % of Total Fund Manager Exposure? Fossil Fuels Coal Reviewed By As of DOMESTIC EQUITY Domestic Equity Fund S&P 500 Index Fund Mid Cap Value Fund SMID Cap Growth Fund INTERNATIONAL EQUITY International Value Fund International Equity Fund International Small Cap Fund International SMID Cap Fund EMERGING MARKETS EQUITY Emerging Markets Value Fund Tax-Managed Emerging Markets Fund FIXED INCOME Bond Yield Fund Bond Market Index Fund Treasury Index Fund Global Fixed Income Fund PUBLIC REAL ASSETS/INFLATION-HEDGING TIPS Index Fund Commodities Fund Securities Fund TOTAL Y Y N N 8.52% 0.75% 0.00% 0.00% 6.88% 0.64% 0.00% 0.00% 0.30% 0.11% 0.00% 0.00% 1.34% 0.00% 0.00% 0.00% PBA PBA PBA PBA 9/30/2014 9/30/2014 9/30/2014 9/30/2014 8.49% 8.14% 0.60% 1.83% PBA PBA PBA PBA 9/30/2014 9/30/2014 9/30/2014 9/30/2014 Y Y Y Y 4.31% 3.97% 0.60% 1.83% 0.00% 0.00% 0.00% 0.00% 4.18% 4.17% 0.00% 0.00% Y 4.87% 4.87% 0.00% 0.00% PBA 9/30/2014 N 0.00% 0.00% 0.00% 0.00% PBA 9/30/2014 Y Y N N 3.12% 3.44% 0.00% 0.00% 2.68% 1.97% 0.00% 0.00% 0.01% 0.21% 0.00% 0.00% 0.44% 1.27% 0.00% 0.00% PBA PBA PBA PBA 9/30/2014 9/30/2014 9/30/2014 9/30/2014 N N Y 0.00% 0.00% 1.22% 0.00% 0.00% 0.00% 0.00% 0.00% 0.00% 0.00% 0.00% 1.22% PBA PBA PBA 9/30/2014 9/30/2014 6/30/2014
Building the Portfolio Where to Start Holdings are 100% Transparent Holdings are not 100% Transparent U.S. Equity Index Mutual Fund (D) Non-U.S. Index Mutual Fund (D) Active Equity Mutual Fund (D) Real Asset Commingled Fund (M) Can replace with mission aligned option Treasury Mutual Fund (D) Sovereign Debt Mutual Fund (D) Real Estate Mutual Fund (D) Limited opportunities to replace with mission aligned option, but does not contradict values Limited opportunities to replace with mission aligned option, may have exposure to unwanted investments Emerging Markets Mutual Fund (D) Long Short Hedge Fund(D) Abs. Ret Hedge Fd (Q) Hedge FOF (Q) (D) - Daily transparency (M) - Monthly transparency (Q) - Quarterly transparency