Four-Year Mushroom Sales Trends Overview
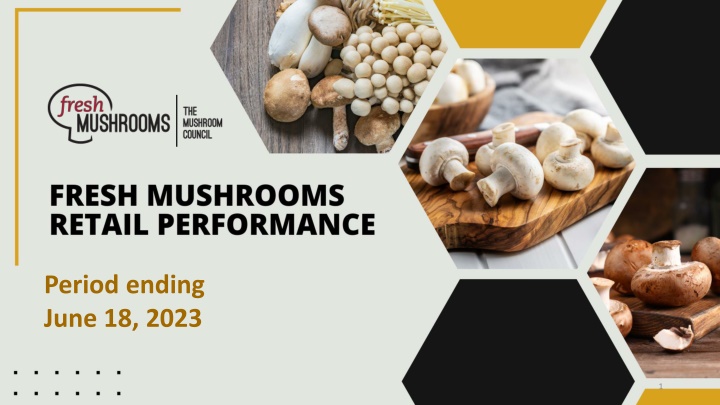
The report covers the four-year dollar sales trend, unit sales trend, and volume (pound) sales trend of fresh mushrooms, analyzing how they have performed against prior year levels. It provides insights into the market pressure and stability of mushroom contribution to the produce and vegetable categories over the past four years. The data is based on the Circana total multi-outlet (MULO) universe for specific periods ending in June 2023.

Download Presentation

Please find below an Image/Link to download the presentation.
The content on the website is provided AS IS for your information and personal use only. It may not be sold, licensed, or shared on other websites without obtaining consent from the author.If you encounter any issues during the download, it is possible that the publisher has removed the file from their server.
You are allowed to download the files provided on this website for personal or commercial use, subject to the condition that they are used lawfully. All files are the property of their respective owners.
The content on the website is provided AS IS for your information and personal use only. It may not be sold, licensed, or shared on other websites without obtaining consent from the author.
E N D
Presentation Transcript
Period ending June 18, 2023 1
Methodology The report covers the four weeks ending 18 June, 2023 with week endings: May 28, 2023 June 4, 2023 June 11, 2023 June 18, 2023 Dollar references are the retail value, volume is reflected in pounds and units (packages) Data is based on the Circana total multi-outlet (MULO) universe, which includes supermarkets, supercenters, club, commissaries, etc. It excludes specialty stores (Whole Foods, Sprouts, etc.) and Costco Package size has been updated to reflect the total market rather than being SKU-based Source: Circana, Integrated Fresh, MULO, 4 weeks ending 6/18/2023 2
Four-year dollar sales trend Sales trended below year-ago levels in the shorter- and longer-term views but are starting to level off Fresh mushrooms dollar sales four w.e. 6/18/2023 Fresh mushrooms dollar sales latest 52 w.e. 6/18/2023 $109.5M $1.4B $98.0M $1.3B $1.3B $95.5M $1.3B $93.2M 3YA 2YA YA 4 w.e. 6/18/23 3YA 2YA YA 52 w.e. 6/18/23 Source: Circana, Integrated Fresh, MULO, 4 weeks and 52 w.e. 6/18/2023 versus same periods the past four years 3
Four-year unit sales trend The shorter- and longer-term unit trends reflect the market pressure, being well behind prior year levels Fresh mushrooms unit sales four w.e. 6/18/2023 Fresh mushrooms unit sales latest 52 w.e. 6/18/2023 40,965,177 513,758,670 488,465,628 36,259,560 462,366,641 432,373,359 32,560,851 31,392,626 3YA 2YA YA 4 w.e. 6/18/23 3YA 2YA YA 52 w.e. 6/18/2023 Source: Circana, Integrated Fresh, MULO, 4 weeks and 52 w.e. ending 6/18/2023 versus same periods the past four years 4
Four-year volume (pound) sales trend In the YTD and the quad-week view, pounds continued to trend behind last year s and prior years levels Fresh mushrooms volume sales latest 52 w.e. 6/18/2023 Fresh mushrooms volume sales four w.e. 6/18/2023 324,331,297 25,795,216 302,841,416 290,880,707 22,908,800 272,408,941 20,407,493 19,787,152 3YA 2YA YA 4 w.e. 6/18/23 3YA 2YA YA 52 w.e. 6/18/23 Source: Circana, Integrated Fresh, MULO, 4 weeks and 52 w.e. ending 6/18/2023 versus same periods the past four years 5
Mushroom contribution to the department and category The mushroom share of total produce and vegetables remains below average but has held stable in the past few months 4 w.e. 6/18/2023 Mushroom $ share Share of total produce Share of total vegetables L-52 w.e. 6/18/2023 Mushroom $ share Share of total produce Share of total vegetables 3YA 1.9% 3.8% 3YA 1.9% 3.8% 2YA 1.6% 3.6% 2YA 2.0% 3.9% YA 1.5% 3.3% YA 1.8% 3.6% 4 w.e. 6/18/2023 1.5% 3.2% 52 w.e. 6/18/2023 1.7% 3.4% Source: Circana, Integrated Fresh, MULO, 4 weeks and 52 w.e. ending 6/18/2023 6
Mushrooms price per unit On a per unit basis, mushroom prices were virtually unchanged from year-ago levels, much like total vegetables and produce. 4 w.e. 6/18/2023 Average price/unit Total produce Total vegetables Mushrooms 3YA $2.29 $2.01 $2.67 2YA $2.42 $2.01 $2.70 YA $2.63 $2.22 $2.93 4 w.e. 6/18/2023 $2.66 | +1.0% $2.26 | +1.7% $2.97 | +1.2% Source: Circana, Integrated Fresh, MULO, YTD weeks ending 6/18/2023 7
Mushroom price per volume (pound) On a pound basis, mushroom inflation was below average, with total produce increasing 3.9% in the four-week period versus +0.6% for fresh mushrooms 4 w.e. 6/18/2023 Average price/pound Total produce Total vegetables Mushrooms 3YA $1.52 $1.80 $4.25 2YA $1.60 $1.88 $4.28 YA $1.72 $1.98 $4.68 4 w.e. 6/18/2023 $1.79 | +3.9% $2.03 | +2.3% $4.71 | +0.6% Source: Circana, Integrated Fresh, MULO, YTD weeks ending 6/18/2023 8
Price per volume by quarter/month The rate of inflation on a per pound basis peaked in the middle of 2022 Mushrooms price per pound and change vs. YA (fixed and random weight) $4.80 9.0% $4.60 $4.68 $4.71 $4.69 $4.63 $4.61 7.9%8.4% 6.9% $4.71 $4.70 8.0% $4.60 7.0% $4.48 $4.50 $4.40 6.0% $4.40 $4.19$4.25 $4.23$4.25$4.27 $4.27$4.32 5.0% $4.30 4.9% 4.9% 4.0% $4.20 $4.13 3.5% 3.0% $4.10 3.1% 2.0% 2.5% $4.00 2.3% 2.3% 2.1% 2.1% 1.9% 1.8% 1.0% $3.90 1.3% 0.4% Q2 21 0.6% 4 we 6/18/23 $3.80 0.0% 2019 4 we 4/23/23 4 we 5/21/23 Q1 20 Q2 20 Q3 20 Q4 20 Q1 21 Q3 21 Q4 21 Q1 22 Q2 22 Q3 22 Q4 22 Q1 23 Source: Circana, Integrated Fresh, MULO, 2019-w.e. 6/18/2023 9
Price per volume and unit by type 4 w.e.6/18/2023 Price per pound % change vs. 22 % change vs. 21 Total mushrooms $4.71 +0.6% +10.1% White mushrooms $4.14 +0.4% +9.4% Brown mushrooms $5.14 -0.4% +10.8% Specialty mushrooms $13.83 +1.1% +14.8% 4 w.e. 6/18/2023 Price per unit % change vs. 22 % change vs. 21 Total mushrooms $2.97 +1.2% +9.8% White mushrooms $2.69 +0.9% +8.9% Brown mushrooms $3.22 +0.7% +10.5% Specialty mushrooms $4.73 +1.7% +15.1% Brown mushrooms include crimini and portabella Specialty mushrooms include shiitake, oyster, enoki, chanterelle, morel, wood ear, porcini, black forest and other Source: Circana, Integrated Fresh, MULO, 4 w.e. 6/18/2023 10
Mushroom dollar, unit, volume sales Double-digit pressure for a number of years 4 w.e. 6/18/2023 dollars $93.2M -2.4% -3.6% -3.0% Dollar Unit Volume growth vs. YA growth vs. YA growth vs. YA volume (lbs) 19.8M -4.9% vs. 21 -15.0% vs. 20 -13.6% vs. 21 -23.3% vs. 20 -13.4% vs. 21 -23.4% vs. 20 Source: Circana, Integrated Fresh, MULO, 4 weeks ending 6/18/2023 11
Vegetables and mushroom dollar sales vs. YA and 3YA Now going up against the April 2020 spikes, sales drop behind the 3YA levels Dollar sales versus year ago and three years ago Fresh vegetables vs YA Fresh mushrooms vs. YA 20.0% 15.1% 7.1% 5.6% 4.3% 4.0% 3.9% 2.2% 2.1% 1.7% 0.5% 0.1% -1.3% Q3 '22 -1.4% 2021 0.6% -1.7% -1.9% 4 we 4/23/23 -1.7% 4 we 5/21/23 2019 2020 Q1 '22 Q2 '22 Q4 '22 Q1 '23 -2.4% 4 we 6/18/23 -3.2% -5.5% -5.8% Source: Circana, Integrated Fresh, MULO, 2019-w.e. 6/18/2023 12
Vegetables and mushroom pound sales vs. YA and 2019 Vs. 3YA levels shows just how high the pandemic spikes were Volume (pound) sales versus year ago and three years ago Fresh vegetables vs YA Fresh vegetables vs. 3YA Fresh mushrooms vs. YA Fresh mushrooms vs. 3YA 17.0% 13.4% 15.1% 8.5% 5.9% 4.3% 3.0% 2.0% -0.4% 1.0% 0.4% -1.6% -0.4% -0.8% -1.0% -1.4% -0.1% -1.8% Q3 '22 -2.1% Q1 '23 -2.3% Q4 '22 2019 2020 2021 Q1 '22 Q2 '22 4 we 4/23/23 4 we 5/21/23 4 we 6/18/23 -3.0% -2.9% -3.1% -3.9% -4.1% -5.4% -6.3% -5.9% -9.5% -7.3% -8.3% -11.3% -8.9% -10.2% -10.2% -19.9% -18.5% -23.3% -23.7% -26.0% Source: Circana, Integrated Fresh, MULO, 2019-w.e. 6/18/2023 13
Share of dollars sold on merchandising Promotions are gearing up fast in mushrooms and most areas of the store. In some cases, promotions are now exceeding 2019 levels. In the latest four weeks, 19% of dollars were sold on promotion, up 34% from year ago Fresh mushrooms 4 w.e. Vs. Latest 52 w.e. 6/18/2023 Vs. 6/18/2023 2022 2022 Share of dollars sold on promotion 18.8% +34.0% 16.5% +13.5% * Any merchandising, including feature, display, feature & display and temporary price reductions Source: Circana, Integrated Fresh, MULO, YTD through weeks ending 6/18/2023 14
Base and incremental sales Incremental sales remain a very small part of the business Dollar sales w.e. 6/18/2023 Volume sales w.e. 6/18/2023 Base Incremental Base Incremental $1,400,000,000 300,000,000 3.3% incremental 6.5% incremental $1,200,000,000 250,000,000 $1,000,000,000 200,000,000 $800,000,000 150,000,000 $600,000,000 100,000,000 $400,000,000 3.9% incremental 6.7% incremental 50,000,000 $200,000,000 $0 0 L-52 we 6/18/23 4 we 6/18/23 L-52 we 6/18/23 4 we 6/18/23 Source: Circana, Integrated Fresh, MULO, 4 weeks ending 6/18/2023 15
Over indexing versus under indexing regions The Mid-South and West regions had a strong 6/18 performance Use as comparison to understand importance/size of mushrooms L-52 w.e. 6/18/2023 Share of veg. $ Share of mushrooms $ $ sales growth WEST WEST PLAINS PLAINS vs. YA GREAT LAKES GREAT LAKES Total US California Great Lakes Mid-South Northeast Plains South Central Southeast West 100.0% 11.4% 100.0% 12.4% -1.1 % -1.4% NORTHEAST NORTHEAST 13.2% 13.2% 18.0% 6.6% 9.1% 15.6% 12.8% 15.1% 11.9% 17.9% 6.3% 7.3% 13.6% 15.5% -1.2% +0.4% -2.8% -2.3% -1.8% -0.7% +0.7% MID SOUTH MID SOUTH CALIFORNIA CALIFORNIA SOUTHEAST SOUTHEAST SOUTH CENTRAL SOUTH CENTRAL = Above-average share vs. veg = Above-average performance vs. total US Source: Circana, Integrated Fresh, MULO, YTD through 6/18/2023 | Total fresh vegetables and total fresh mushrooms 16
Performance summary whites, browns and specialty Brown (combination of crimini and ports) and specialty mushrooms are outperforming white mushrooms in dollars and volume Dollar share $ sales vs. 2022 $ sales vs. 2020 Volume (lbs) Lbs Lbs Lbs vs. 2020 4 weeks ending 6/18/2023 Dollars share vs. 2022 $93.2M 100.0% -2.4% -15.0% 19.8M 100.0% -3.0% -23.3% Total fresh mushrooms $48.7M 52.3% -5.0% -19.5% 11.8M 59.4% -5.3% -26.4% White mushrooms $39.4M 42.3% 0.0% -9.7% 7.7M 38.8% +0.4% -18.3% Brown mushrooms $5.1M 5.4% +5.3% -5.9% 0.4M 1.9% +4.1% -15.9% Specialty mushrooms Source: Circana, Integrated Fresh, MULO, 4 weeks ending 6/18/2023 17
White button mushrooms dollar performance Dollars L-52 w.e. 6/18/2023 $671.7M -2.8% vs. YA White button mushroom, $ and % vs YA (fixed and random weight) 15.0% $250,000,000 10.0% $191M $173M$182M $175M $176M $200,000,000 $169M$158M $168M$158M 5.0% 4.6% 0.0% $150,000,000 -3.2% -2.7% -2.0% -3.0% -2.7% -3.4% -6.7% -5.0% -5.0% $100,000,000 -6.3% -10.0% $51.7M $50.2M $48.7M $50,000,000 -10.8% -15.0% Average price/unit $2.66 +4.9% vs. YA -16.4% -20.0% $0 Q1 21 Q2 21 Q3 21 Q4 21 Q1 22 Q2 22 Q3 22 Q4 22 Q1 23 4 WE 4/23/23 4 WE 5/21/23 4 WE 6/18/23 Source: Circana, Integrated Fresh, MULO, 2021 plus 4 weeks ending 6/18/2023 18
White button mushrooms volume performance Pounds L-52 w.e. 6/18/2023 163.7M -7.4% vs YA White button mushroom, lbs and % vs YA (fixed and random weight) 15.0% 60,000,000 50.7M 10.0% 44.4M46.0M 45.1M 50,000,000 42.4M 42.9M 3.5% 41.4M 41.6M 5.0% 38.5M 40,000,000 0.0% -3.1% -4.5% -5.3% 30,000,000 -7.1% -7.5% -5.0% -9.6%-11.0%-9.8% -9.9% -12.2% 20,000,000 -10.0% 12.8M 12.5M 11.8M -15.7% -15.0% 10,000,000 Average price/pound $4.10 +4.9% vs. YA -20.0% - Q3 21 Q1 21 Q2 21 Q4 21 Q1 22 Q2 22 Q3 22 Q4 22 Q1 23 4 WE 4/23/23 4 WE 5/21/23 4 WE 6/18/23 Source: Circana, Integrated Fresh, MULO, 2021 plus 4 weeks ending 6/18/2023 19
Crimini mushrooms dollar performance Dollars L-52 w.e. 6/18/2023 $428.5M +8.1% vs. YA Crimini mushroom, $ and % vs YA (fixed and random weight) 20.0% $140,000,000 15.6% $113M $116M 11.1% 15.0% $110M $97M 7.7% $120,000,000 $108M $98.5M $97M 7.7% 6.7% $95.8M 6.5% 10.0% 6.2% $100,000,000 $89.2M 5.0% 1.4% $80,000,000 -3.1% 0.0% -5.8% $60,000,000 -6.7% -5.0% $33.3M $32.3M $31.5M $40,000,000 -10.0% -9.1% Average price/unit $3.22 +6.2% vs. YA -15.0% $20,000,000 -20.0% $0 Q1 22 Q1 21 Q2 21 Q3 21 Q4 21 Q2 22 Q3 22 Q4 22 Q1 23 4 WE 4/23/23 4 WE 5/21/23 4 WE 6/18/23 Source: Circana, Integrated Fresh, MULO, 2021 plus 4 weeks ending 6/18/2023 20
Crimini mushrooms volume performance Pounds L-52 w.e. 6/18/2023 87.5M +1.1% vs. YA Crimini mushroom, lbs and % vs YA (fixed and random weight) 15.4% 20.0% 30,000,000 25.3M 15.0% 23.6M 23.5M 22.8M 22.0M 25,000,000 21.9M 7.5% 10.0% 20.2M 20.1M 19.9M 4.5% 3.9% 2.3% 20,000,000 5.0% 0.8% -2.0% 0.0% 15,000,000 -8.5%-8.3% -7.8% -8.3% -5.0% -8.9% 10,000,000 6.8M 6.6M 6.5M -10.0% Average price/pound $4.90 +6.9% vs. YA 5,000,000 -15.0% -20.0% 0 Q3 22 Q1 21 Q2 21 Q3 21 Q4 21 Q1 22 Q2 22 Q4 22 Q1 23 4 WE 4/23/23 4 WE 5/21/23 4 WE 6/18/23 Source: Circana, Integrated Fresh, MULO, 2021 plus 4 weeks ending 6/18/2023 21
Other insights Packaged (fixed weight) versus random weight Package-size analysis Organic versus conventional Value-added versus whole/uncut 22
Package size analysis 8 and 16 ounces drive the bulk of sales; 16-ounce packages outperformed 8-ounces in the latest four weeks when compared to last year. Compared with two years ago, 8-ounce packages did better Package size (per UPC) lbs vs. Dollars $ vs. YA $ vs. 2YA Pounds lbs vs. 2YA YA 8 OZ $48.6M -4.5% -4.8% 9.8M -4.3% -12.5% 16 OZ $17.8M -1.0% -6.9% 4.6M -4.3% -16.8% Source: Circana, Integrated Fresh, MULO, 4 weeks ending 6/18/2023 23
Packaged (fixed weight) versus random weight While both down, fixed weight did better than random weight 4 W.E. 6/18/2023 | Share of total mushroom sales and sales growth % Fixed weight Random weight Dollar growth -2.2% -6.9% Share of mushroom $ sales 95.5% 4.5% Volume growth -2.9% -6.2% Share of mushroom lbs sales 96.1% 3.9% Source: Circana, Integrated Fresh, MULO, 4 weeks ending 6/18/2023 24
Organic versus conventional mushrooms sales Organic mushrooms increased in dollar, unit and volume sales 4 w.e. 6/18/2023 | Share of total mushroom sales and sales growth % Unit growth -4.1% Volume growth -3.4% Market size $81.0M $ Conventional growth -3.2% Unit growth +0.7% Volume growth +0.4% Market size $12.2M $ Organic growth +3.0% 9.9% of pound sales Source: Circana, Integrated Fresh, MULO, 4 weeks ending 6/18/2023 compared with year ago 25
Cut/prepared versus whole mushrooms No preparation (whole) had the better performance 4 w.e. 6/18/2023 | Share of total mushroom sales and sales growth % Unit growth -0.2% Volume growth +0.4% Market size $46.5M $ No preparation growth +0.3% Unit growth -6.7% Volume growth -6.7% Market size $46.7M $ Cut/Sliced growth -5.0% 46.8% of lbs sales Source: Circana, Integrated Fresh, MULO, 4 weeks ending 6/18/2023 compared with year ago 26


 sales trend")


")


 versus random weight")