Framework for Carbon Monitoring and Upscaling in Mexican Forests
This project focuses on standardizing methodologies, characterizing uncertainties, and identifying hot spots for REDD+ implementation in Mexican forests. It involves intensive monitoring at various sites across Mexico to collect data on vegetation, biomass, and soil. The study sites include diverse locations such as Yucatan, Quintana Roo, Chiapas, Hidalgo, and Sonora. Data collection methods include GPP, woody debris flux, biomass measurement, and soil sampling. The project aims to share upscaled information online and contribute to understanding forest dynamics and carbon sequestration in Mexico.

Download Presentation

Please find below an Image/Link to download the presentation.
The content on the website is provided AS IS for your information and personal use only. It may not be sold, licensed, or shared on other websites without obtaining consent from the author.If you encounter any issues during the download, it is possible that the publisher has removed the file from their server.
You are allowed to download the files provided on this website for personal or commercial use, subject to the condition that they are used lawfully. All files are the property of their respective owners.
The content on the website is provided AS IS for your information and personal use only. It may not be sold, licensed, or shared on other websites without obtaining consent from the author.
E N D
Presentation Transcript
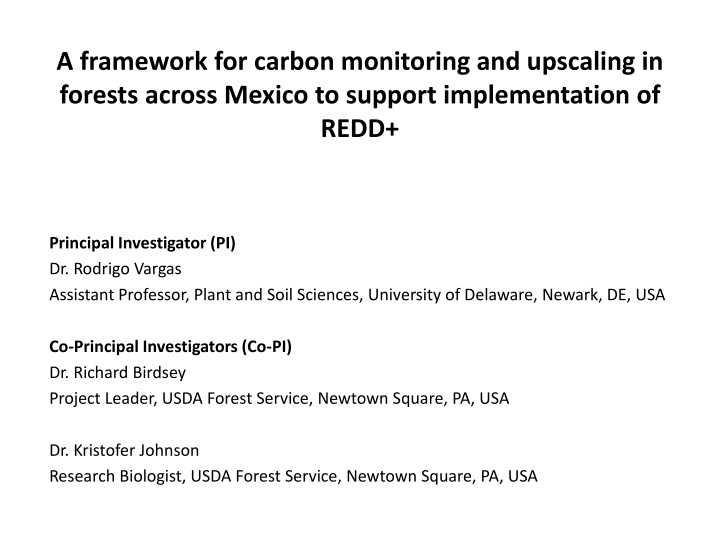
A framework for carbon monitoring and upscaling in forests across Mexico to support implementation of REDD+ Principal Investigator (PI) Dr. Rodrigo Vargas Assistant Professor, Plant and Soil Sciences, University of Delaware, Newark, DE, USA Co-Principal Investigators (Co-PI) Dr. Richard Birdsey Project Leader, USDA Forest Service, Newtown Square, PA, USA Dr. Kristofer Johnson Research Biologist, USDA Forest Service, Newtown Square, PA, USA
Work Plan Year 1 3 Objective 1: Standardize ongoing methodologies across sites. Coordinate across sites to establish standardize data collection and data framework for modeling, validation, and scaling purposes. Year 1 3 Objective 2: Characterize extremes and uncertainties. Incorporate site-level measurements to validate landscape and regional products. Year 2 3 Objective 3: Identify hot-spots suitable for REDD+ and assess forest vulnerability Completed upscaling products, analysis of extreme values, and temporal trends of change across forests in Mexico. Online- data sharing of up-scaled information.
Data Collection Intensive forest monitoring sites Site Location Vegetation Kaxil Kiuic Yucatan Deciduous broadleaf Uyoolche Quintana Roo Deciduous broadleaf La Encrucijada Chiapas Mangrove Atopixco Hidalgo Evergreen needleleaf Alamos Sonora Deciduous broadleaf GPP, gC m-2 yr-1 Down Woody Debris Flux Tower Aboveground Biomass Quantitative Soil Samp.
Intensive Site Design Characteristics 1X1 km area densely sampled 3X3 total area (validation area) Plots FIA like design Local academic institution to manage the site Alamos, Sonora, Mexico
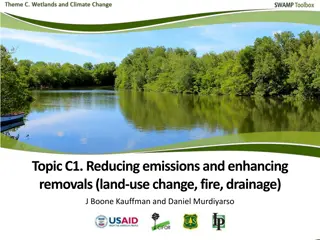
Study Site Biosphere Reserve La Encrucijada
Ground based data Biosphere Reserve La Encrucijada Production (litterfall) 11 sites from 1999-2003, this database includes biophysical parameters (e.g. salinity, temperature). Vegetation structure from 2009 to 2011. CLIMCOM includes precipitation and temperature from 1980 to 2010. Vegetation structure Litterfall CLICOM
Litterfall sites are stablished following a gradient taking into account distance to inland, therefore we have two main clusters and a south away point from inland site. 1) Cluster 1 (green circle) 2) Cluster 2 (orange circle) 3) Point (blue circle)
La encrucijada Sites Seasonality in Litterfall production is observed along with biophysical parameters such as temperature and interstitial salinity (IS) Sites closest to inland have less IS and lower temperature resulting in a slightly higher litterfall production
Mean Standard Euclidian Distance a b c d e 0.36-0.57 0.58-0.62 0.63-0.66 0.67-0.7 0.71-0.91 Human Development Index Low High
Causes of Forest Disturbances by Country Not including Indirect Human-Induced Percentage of disturbed forest land by cause, per year 100 Mostly deforestation and forest degradation 90 80 70 60 Human 50 Natural 40 30 20 10 0 Canada United States Mexico 2.9% 3.2% 2.1% Percentage of forest land disturbed annually
Results from Year 1 Activity Data (status) 1. Continued data collections at 2 sites Atopixco and Kiuic. Aboveground biomass (100%) Down woody debris (100%) Soil bulk density (100%) Lab soil analyses - C, N, texture, water holding capacity (~50%) 2. Established new data collections at 2 site Alamos and La Encrucijada Aboveground biomass (~20%) Down woody debris (~75%) Soil bulk density (~90%) Lab soil analyses (0%) 3. Started DNDC modeling at Atopixco and Kiuic. Kiuic: NEP outputs finished Dai et al. 2014. (but could use refining with new data) Atopixico: model calibrating stage for baseline NPP/GPP. 4.- Identification of hotspots of carbon change across Mexico Preliminarily assessment of SED between 2000-2010