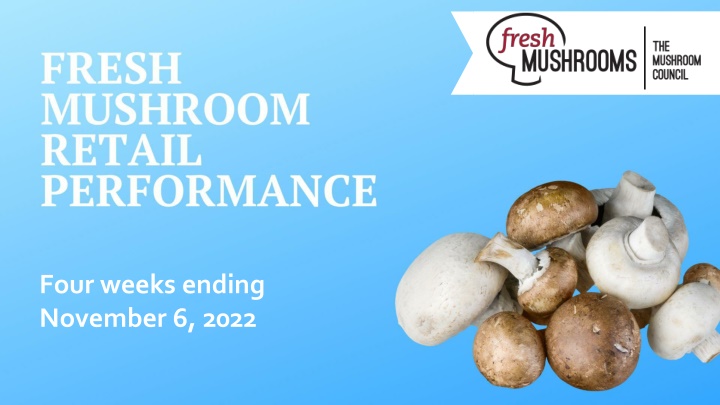
Fresh Mushroom Sales Trends: Four-Year Analysis Ending November 2022
Explore the trends in fresh mushroom sales over four years, ending November 6, 2022. Dollar sales trended below previous years but remained above 2019 levels. Unit and volume sales also showed fluctuations compared to 2019 data. Dive into the data to understand the market performance of fresh mushrooms in the retail sector.

Download Presentation

Please find below an Image/Link to download the presentation.
The content on the website is provided AS IS for your information and personal use only. It may not be sold, licensed, or shared on other websites without obtaining consent from the author. If you encounter any issues during the download, it is possible that the publisher has removed the file from their server.
You are allowed to download the files provided on this website for personal or commercial use, subject to the condition that they are used lawfully. All files are the property of their respective owners.
The content on the website is provided AS IS for your information and personal use only. It may not be sold, licensed, or shared on other websites without obtaining consent from the author.
E N D
Presentation Transcript
Four weeks ending November 6, 2022
Methodology IRI data underwent its annual restatement, which included a realignment of the quad-weeks. The periods jumped back by one week. What was w.e. 10/2 became 10/9, which will be the new alignment going forward. The 52-week view in the database has been adjusted to see all the back quad-week periods using this restatement The report covers the four weeks ending November 6, 2022 with week endings: October 16, 2022 October 23, 2022 October 30, 2022 November 6, 2022 Comparisons to year ago (YA) refer to 2021; comparisons to two years ago (2YA) refer to 2020 and 3YA to 2019 Dollar references are the retail value, volume is reflected in pounds Data is based on the IRI total multi-outlet universe, which includes supermarkets, supercenters, club, commissaries, etc. It excludes specialty stores (Whole Foods, Sprouts, etc) Organic, cut/whole, package size, etc are derived from SKU analysis. This means Walmart private brand, H-E-B, Hy-Vee and others are not included, which causes the gap between total market and SKU-level data Source: IRI, Integrated Fresh, MULO, 4 weeks ending 11/06/2022 2
Four-year dollar sales trend Dollar sales fell below YA and 2YA levels, but remained well above 2019 Fresh mushrooms dollar sales four w.e. 11/06/2022 Fresh mushrooms dollar sales YTD through 11/06/2022 $1,168,699,718 $102,672,817 $1,105,807,986 $95,581,147 $1,061,696,690 $92,905,884 $86,410,009 $968,097,788 2019 2020 2021 2022 2019 2020 2021 2022 Source: IRI, Integrated Fresh, MULO, 4 weeks and year-to-date ending 11/06/2022 versus same periods the past four years 3
Four-year unit sales trend Unit sales were below 2019 levels in the quad week and year-to-date views Fresh mushrooms unit sales four w.e. 11/06/2022 Fresh mushrooms unit sales YTD w.e. 11/06/2022 442,441,737 38,602,581 407,991,936 382,413,911 34,747,428 366,744,231 33,972,480 30,758,243 2019 2020 2021 2022 2019 2020 2021 2022 Source: IRI, Integrated Fresh, MULO, 4 weeks and year-to-date ending 11/06/2022 versus same periods the past four years 4
Four-year volume (pound) sales trend In the YTD and the quad-week view, pounds dipped below 2019 Fresh mushrooms volume sales four w.e. 11/06/2022 Fresh mushrooms volume sales YTD w.e. 11/06/2022 276,309,413 24,158,926 257,373,225 234,708,123 21,748,091 230,496,900 20,716,259 19,521,565 2019 2020 2021 2022 2019 2020 2021 2022 Source: IRI, Integrated Fresh, MULO, 4 weeks and year-to-date ending 11/06/2022 versus same periods the past four years 5
Mushroom contribution to the department and category The mushroom share of total produce and vegetables is below prior year levels 4 w.e. 11/06/2022 Mushroom $ share Share of total produce Share of total vegetables YTD through w.e. 11/06/2022 Mushroom $ share Share of total produce Share of total vegetables 2019 1.9% 3.7% 2019 1.8% 3.7% 2020 2.1% 3.8% 2020 1.9% 3.8% 2021 1.8% 3.5% 2021 1.8% 3.7% 2022 1.7% 3.2% 2022 1.7% 3.4% Source: IRI, Integrated Fresh, MULO, 4 weeks and year-to-date ending 11/06/2022 6
Mushrooms price per unit Price increases for mushrooms were above those of total produce and total vegetables for the first time since the start of the pandemic. This was driven by white button mushrooms (slide 10) 4 w.e. 11/06/2022 Average price/unit Total produce Total vegetables Mushrooms 2019 $2.24 $2.06 $2.54 2020 $2.28 $2.12 $2.66 2021 $2.45 $2.23 $2.75 2022 $2.59 | +5.4% $2.42 | +8.4% $3.02 | +9.8% Source: IRI, Integrated Fresh, MULO, YTD weeks ending 11/06/2022 7
Mushroom price per volume (pound) On a pound basis, mushroom inflation was below that of total fresh vegetables, which means other vegetables are adjusting unit size to soften pound inflation 4 w.e. 11/06/2022 Average price/pound Total produce Total vegetables Mushrooms 2019 $1.54 $1.53 $4.17 2020 $1.57 $1.58 $4.25 2021 $1.68 $1.65 $4.39 2022 $1.79 | +6.8% $1.80 | +9.4% $4.76 | +8.3% Source: IRI, Integrated Fresh, MULO, YTD weeks ending 11/06/2022 8
Price per volume by quarter/month The rate of inflation on a per pound basis moderated somewhat versus the Q3 peak Mushrooms price per pound and change vs. YA (fixed and random weight) $4.90 10.0% $4.76 $4.68 $4.75 $4.80 9.0% $4.70 8.9% 8.8% 8.0% 8.3% $4.56 $4.60 7.0% $4.48 7.0% $4.50 $4.40 6.0% $4.40 $4.32 5.0% $4.27 $4.27 $4.25 $4.23 $4.30 $4.19$4.25 4.9% 4.0% $4.13 $4.20 3.5% 3.0% $4.10 3.1% 2.0% $4.00 2.5% 2.3% 2.3% 2.1% 1.9% 1.8% 1.0% $3.90 $3.80 0.4% Q2 21 0.0% 2019 Q1 20 Q2 20 Q3 20 Q4 20 Q1 21 Q3 21 Q4 21 Q1 22 Q2 22 Q3 22 4 we 10/2 4 we 11/6 Source: IRI, Integrated Fresh, MULO, 2019-11/06/2022 9
Price per volume and unit by type 4 w.e.11/06/2022 Price per pound % change vs. 21 % change vs. 20 Total mushrooms $4.76 +8.3% +12.o% White mushrooms $4.16 +7.0% +10.9% Brown mushrooms $5.14 +8.0% +11.9% Specialty mushrooms $13.96 +1.3% +11.6% 4 w.e. 11/06/2022 Price per unit % change vs. 21 % change vs. 20 Total mushrooms $3.02 +9.8% +13.6% White mushrooms $2.76 +9.9% +14.0% Brown mushrooms $3.22 +8.5% +11.7% Specialty mushrooms $4.67 +4.0% +11.7% Brown mushrooms include crimini and portabella Specialty mushrooms include shiitake, oyster, enoki, chanterelle, morel, wood ear, porcini, black forest and other Source: IRI, Integrated Fresh, MULO, 4 w.e. 11/06/2022 10
Mushroom dollar, unit, volume sales Mushroom dollars still exceed the 2019 levels, but units and volume fell below 4 w.e. 11/06/2022 dollars $92.9M -2.8% -11.5% -10.2% Dollar Unit Volume growth vs. YA growth vs. YA growth vs. YA volume (lbs) 19.5M -9.5% vs. 20 +7.5% vs. 19 -19.2% vs. 20 -5.8% vs. 19 -20.3% vs. 20 -9.5% vs. 19 Source: IRI, Integrated Fresh, MULO, 4 weeks ending 11/06/2022 11
Vegetables and mushroom dollar sales vs. YA and 2019 Both mushrooms and vegetables continued to trend above pre-pandemic levels Dollar sales versus year ago and two years ago Fresh vegetables vs. 2019 Fresh vegetables vs YA Fresh mushrooms vs. YA Fresh mushrooms vs. 2019 35.0% 31.2% 30.0% 23.1% 21.7% 25.0% 19.8% 17.8% 17.4% 20.0% 17.4% 15.6% 15.1% 20.7% 13.5% 13.6% 12.1%12.5% 11.7% 15.0% 14.7% 8.3% 8.6% 15.1% 8.7% 14.8% 7.5% 10.0% 10.1% 10.6% 4.9% 10.2% 4.4% 5.0% 3.1% 6.2% 0.1% 0.1% 4.7% 0.0% -2.4% Q3 2021 Q2 2020 Q3 2020 Q4 2020 Q1 2021 Q2 2021 Q4 2021 Q1 2022 Q2 2022 Q3 2022 4 we 10/2 4 we 11/6 -5.0% -2.8% -3.5% -2.8% -3.9% -5.8% -7.1% -6.4% -10.0% -9.2% -12.6% -15.0% Source: IRI, Integrated Fresh, MULO, 2019-w.e. 11/06/2022 12
Vegetables and mushroom pound sales vs. YA and 2019 Vegetable pounds are now far outpacing fresh mushroom pounds when compared to 2019 and YA Volume (pound) sales versus year ago and two years ago Fresh vegetables vs YA Fresh vegetables vs. 2019 Fresh mushrooms vs. YA Fresh mushrooms vs. 2019 30.0% 27.2% 25.0% 20.5% 20.0% 15.3% 12.4% 15.0% 15.1% 10.7% 9.5% 9.5% 7.4% 10.0% 6.1% 5.9% 10.1% 6.6% 9.7% 3.3% 5.5% 5.0% 6.9% 2.0% 6.1% 3.1% 4.1% 1.8% 1.0% 0.0% -0.7% -3.8% -2.9% 0.0% -5.4% Q1 2020 Q2 2020 Q3 2020 Q4 2020 Q1 2021 Q2 2021 Q3 2021 Q4 2021 Q1 2022 Q2 2022 Q3 2022 4 we 10/2 4 we 11/6 -5.0% -2.5% -3.6% -4.4% -4.2% -5.6% -5.8% -5.4% -8.0% -10.0% -9.6% -10.2% -10.2% -10.2% -10.8% -11.3% -10.9% -12.9% -15.0% Source: IRI, Integrated Fresh, MULO, 2019-w.e. 11/06/2022 13
Share of dollars and pounds sold on merchandising While still low, at 19%, more pounds were sold on promotion, but it did not boost dollar growth equally in the quad-week Fresh mushrooms 4 w.e. Vs. 2021 Building CY thru 11/06/2022 Vs. 2021 11/06/2022 Share of dollars sold on promotion 15.6% -0.0% 15.5% -0.2% Share of pounds sold on promotion 19.0% +9.1% 18.5% +3.2% * Any merchandising, including feature, display, feature & display and temporary price reductions Source: IRI, Integrated Fresh, MULO, YTD through weeks ending 11/06/2022 14
Base and incremental sales The increased level of promotions is driving a higher share of incrementality Volume sales four w.e. 11/06/2022 Dollar sales four w.e. 11/06/2022 Base Incremental Base Incremental $1,200,000,000 250,000,000 6.0% incremental 3.1% incremental $1,000,000,000 200,000,000 $800,000,000 150,000,000 $600,000,000 100,000,000 $400,000,000 50,000,000 $200,000,000 3.3% incremental 6.8% incremental $0 0 YTD 2022 4 we 11/06/22 YTD 2022 4 we 11/06/22 Source: IRI, Integrated Fresh, MULO, 4 weeks ending 11/06/2022 15
Over indexing versus under indexing regions Under indexing regions are catching up Use as comparison to understand importance/size of mushrooms YTD w.e. 11/06/2022 Share of veg. $ Share of mushrooms $ $ sales WEST PLAINS growth vs. YA GREAT LAKES Total US California Great Lakes Mid-South Northeast Plains South Central Southeast West 100.0% 11.5% 13.2% 13.2% 18.1% 6.6% 9.1% 15.4% 12.9% 100.0% 12.8% 15.2% 11.5% 18.2% 6.5% 7.4% 13.4% 15.0% -4.0% -4.4% -4.8% -2.4% -5.5% -3.7% -4.3% -4.5% -1.7% NORTHEAST MID SOUTH CALIFORNIA SOUTHEAST SOUTH CENTRAL = Above-average share = Above-average performance Source: IRI, Integrated Fresh, MULO, YTD through 11/06/2022 | Total fresh vegetables and total fresh mushrooms 16
Performance summary whites, browns and exotics Dollar sales for browns up 22.2% versus pre-pandemic levels and specialty is going strong also Dollar share $ sales vs. 2021 $ sales vs. 2019 Volume (lbs) Lbs Lbs Lbs vs. 2019 4 weeks ending 11/06/2022 Dollars share vs. 2021 $92.9M 100.0% -2.8% +7.5% 19.5M 100.0% -10.2% -5.8% Total fresh mushrooms $47.2M 50.8% -8.4% -3.5% 11.3M 58.0% -14.4% -14.2% White mushrooms $40.0M 43.1% +3.6% +22.2% 7.8M 39.9% -4.1% +9.5% Brown mushrooms $5.7M 6.1% +5.2% +19.0% 0.4M 2.1% +3.8% +0.5% Specialty mushrooms Source: IRI, Integrated Fresh, MULO, 4 weeks ending 11/06/2022 17
White button mushrooms dollar performance Dollars YTD through 11/06/2022 $557M White button mushroom, $ and % vs YA (fixed and random weight) 15.0% $250,000,000 10.0% $191M $182M $200,000,000 $173M $169M $168M 5.0% -5.7% vs YA $154M $158M 4.6% $150,000,000 0.0% -4.2% -4.6% -6.7% -5.0% -7.1% -8.4% $100,000,000 Average price/unit $2.63 -6.3% -10.0% $47.2M $47.0M -10.8% $50,000,000 -15.0% -16.4% -20.0% $0 Q1 21 Q2 21 Q3 21 Q4 21 Q1 22 Q2 22 Q3 22 4 WE 10/2 4 WE 11/6 +6.4% vs YA Source: IRI, Integrated Fresh, MULO, 2021 plus 4 weeks ending 11/06/2022 18
White button mushrooms volume performance Pounds YTD through w.e. 11/06/2022 138M White button mushroom, lbs and % vs YA (fixed and random weight) 15.0% 60,000,000 50.7M 10.0% 46.7M 46.0M 3.5% 50,000,000 45.1M 44.4M 5.0% 42.6M 41.6M -11.7% vs YA 0.0% 40,000,000 -5.0% -9.6% -10.1% -11.0% 30,000,000 -12.0% -12.2% -10.0% -14.2% -14.4% -15.7% Average price/pound $4.05 -15.0% 20,000,000 11.3M 11.3M -20.0% 10,000,000 -25.0% -30.0% - Q1 21 Q2 21 Q3 21 Q4 21 Q1 22 Q2 22 Q3 22 4 WE 10/2 4 WE 11/6 +6.8% vs. YA Source: IRI, Integrated Fresh, MULO, 2021 plus 4 weeks ending 11/06/2022 19
Crimini mushrooms dollar performance Dollars YTD through w.e. 11/06/2022 $342M Crimini mushroom, $ and % vs YA (fixed and random weight) 20.0% $120,000,000 $109.9M $107.7M $99.0M $98.5M 15.0% $95.8M $95.2M 10.7% 15.6% $100,000,000 $89.2M 8.3% 10.0% 5.7% +2.7% vs. YA $80,000,000 5.0% 0.5% 0.0% $60,000,000 -3.1% -5.8% -5.0% -6.7% $32.4M Average price/unit $3.14 $30.8M $40,000,000 -10.0% -9.1% $20,000,000 -15.0% -20.0% $0 Q1 21 Q2 21 Q3 21 Q4 21 Q1 22 Q2 22 Q3 22 4 WE 10/2 4 WE 11/6 +7.5% vs. YA Source: IRI, Integrated Fresh, MULO, 2021 plus 4 weeks ending 11/06/2022 20
Crimini mushrooms volume performance Pounds YTD through w.e. 11/06/2022 71.7M Crimini mushroom, lbs and % vs YA (fixed and random weight) 20.0% 30,000,000 25.3M 15.0% 23.5M 25,000,000 22.0M 21.9M 15.4% 10.0% 20.8M 19.5M 20.1M -5.5% vs. YA 20,000,000 5.0% 1.3% -1.3% 0.0% -4.4% 15,000,000 -5.0% Average price/pound $4.78 10,000,000 6.6M -7.8% 6.3M -8.2% -10.0% -8.5% -8.9% -8.3% 5,000,000 -15.0% -20.0% - Q1 21 Q2 21 Q3 21 Q4 21 Q1 22 Q2 22 Q3 22 4 WE 10/2 4 WE 11/6 +8.7% vs. YA Source: IRI, Integrated Fresh, MULO, 2021 plus 4 weeks ending 11/06/2022 21
OTHER INSIGHTS Packaged (fixed weight) versus random weight Package-size analysis Organic versus conventional Value-added versus whole/uncut 22
Packaged (fixed weight) versus random weight While both down, fixed weight did better than random weight 4 W.E. 11/06/2022 | Share of total mushroom sales and sales growth % Fixed weight Random weight Dollar growth -9.4% -5.6% Share of mushroom $ sales 94.9% 5.1% Volume growth -17.7% -7.1% Share of mushroom lbs sales 95.5% 4.5% Source: IRI, Integrated Fresh, MULO, 4 weeks ending 11/06/2022 UPC-level analysis which excludes certain items due to IRI/retailer agreements 23
Package size analysis 8 and 16 ounces drive the bulk of sales; 8 ounce had another strong performance Package size (per UPC) lbs vs. YA lbs vs. 2YA Dollars $ vs. YA $ vs. 2YA Pounds <8 OZ $8.2M -4.5% -10.7% 0.7M -14.4% -24.4% 8 OZ $45.1M -10.5% -17.5% 8.8M -19.0% -27.6% >8 OZ < 16 OZ $5.4M -1.9% -12.9% 1.2M -7.4% -20.2% 16 OZ $14.3M -20.6% -22.3% 3.7M -26.2% -30.2% >16 OZ $8.2M +12.8% +7.6% 2.5M -1.5% -13.9% Random weight $4.1M -2.7% -16.9% 0.8M -3.5% -23.2% Source: IRI, Integrated Fresh, MULO, 4 weeks ending 11/06/2022 UPC-level analysis which excludes certain items due to IRI/retailer agreements 24
Organic versus conventional mushrooms sales The organic share of mushroom dollar sales reached 13.8% 4 w.e. 11/06/2022 | Share of total mushroom sales and sales growth % Unit growth -18.7% Volume growth -18.2% Market size $73.1M $ growth -10.7% Conventional Unit growth -7.0% Volume growth -8.9% Market size $12.1M $ growth +0.6% Organic 11.3% of pound sales Source: IRI, Integrated Fresh, MULO, 4 weeks ending 11/06/2022 compared with year ago UPC-level analysis which excludes certain items due to IRI/retailer agreements 25
Cut/prepared versus whole mushrooms No preparation (whole) had the better performance 4 w.e. 11/06/2022 | Share of total mushroom sales and sales growth % Unit growth -13.8% Volume growth -13.8% Market size $41.2M $ growth -4.8% No preparation Unit growth -20.5% Volume growth -20.6% Market size $44.1M $ growth -13.0% Cut/prepped 48.9% of lbs sales Source: IRI, Integrated Fresh, MULO, 4 weeks ending 11/06/2022 compared with year ago UPC-level analysis which excludes certain items due to IRI/retailer agreements 26


 sales trend")


")


 versus random weight")


![[✔PDF✔⚡] Renal Diet Cookbook for the Newly Diagnosed: The Complete Guide to](/thumb/68079/pdf-renal-diet-cookbook-for-the-newly-diagnosed-the-complete-guide-to.jpg)