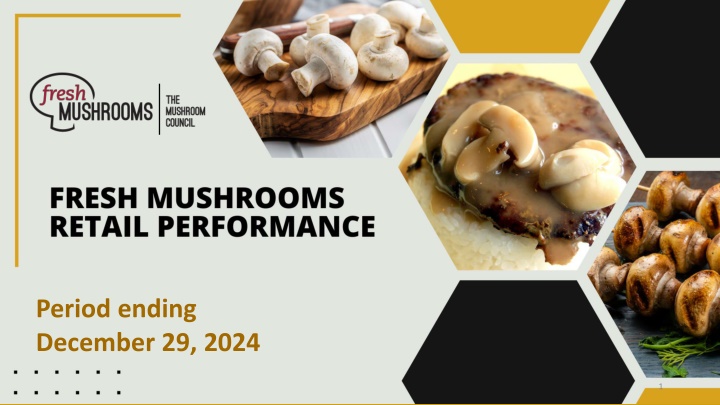
Fresh Mushrooms Sales Analysis - December 29, 2024 Quad-Week Report
Explore the detailed analysis of fresh mushrooms sales trends for the quad-week ending December 29, 2024. Discover the dollar sales, unit sales, and volume sales over the past four years, providing valuable insights for the produce and vegetable categories.

Download Presentation

Please find below an Image/Link to download the presentation.
The content on the website is provided AS IS for your information and personal use only. It may not be sold, licensed, or shared on other websites without obtaining consent from the author. If you encounter any issues during the download, it is possible that the publisher has removed the file from their server.
You are allowed to download the files provided on this website for personal or commercial use, subject to the condition that they are used lawfully. All files are the property of their respective owners.
The content on the website is provided AS IS for your information and personal use only. It may not be sold, licensed, or shared on other websites without obtaining consent from the author.
E N D
Presentation Transcript
Period ending December 29, 2024 1
Methodology The report covers the four weeks ending December 29, 2024 with week endings: December 8, 2024 December 15, 2024 December 22, 2024 December 29, 2024 Please note, during this quad-week, the year-over-year performance is affected by the date cut-off (which is always on a Sunday). In 2023, the corresponding quad-week ended on 12/31 versus 12/29 this year. That means much of the New Year s food dollar was captured in quad week 13 in 2023, but will move, in part, into quad week 1 of 2025 due to the Wednesday timing of the holiday. Dollar references are the retail value, volume is reflected in pounds and units (packages) Package size, organic, fixed/random weight and value-added now all reflect the MULO+ expanded marketplace For questions, contact Anne-Marie Roerink, at aroerink@210analytics.com Source: Circana, Integrated Fresh, MULO+, 4 weeks ending 12/29/2024 2
Four-year dollar sales trend While this quad-week does show a decreasing five-year trend line, the year-over-year drop was accentuated by the cut-off date Fresh mushrooms dollar sales latest 52 w.e. 12/29/2024 Fresh mushrooms dollar sales four w.e. 12/29/2024 $1,641,273,362$1,588,406,358 $1,569,072,852 $1,546,958,087 $1,517,338,161 $135,837,401 $131,089,585 $129,356,034 $127,084,772 $120,981,630 4YA 3YA 2YA YA Latest 4 weeks 4YA 3YA 2YA YA Latest 52 weeks Source: Circana, Integrated Fresh, MULO+, 4 weeks and 52 w.e. 12/29/2024 versus same periods the past four years 3
Four-year unit sales trend Unit sales have declined by more than 100 million packages in comparison to four years ago, however, larger pack sizes (16 and 24 ounce) make up some of the difference Fresh mushrooms unit sales four w.e. 12/29/2024 Fresh mushrooms unit sales latest 52 w.e. 12/29/2024 610,863,312 48,536,424 573,061,837 44,129,274 529,823,568514,557,903500,077,568 41,668,576 40,616,451 39,281,094 4YA 3YA 2YA YA Latest 4 weeks 4YA 3YA 2YA YA Latest 52 weeks Source: Circana, Integrated Fresh, MULO+, 4 weeks and 52 w.e. ending 12/29/2024 versus same periods the past four years 4
Four-year volume (pound) sales trend While typically a strong quad-week for fresh mushrooms, pound sales fell slightly below 27 million pounds this year Fresh mushrooms volume sales latest 52 w.e. 12/29/2024 Fresh mushrooms volume sales four w.e. 12/29/2024 32,660,576 29,864,025 401,138,742380,283,916 28,501,620 27,880,307 26,884,200 351,704,158342,525,180333,558,020 4YA 3YA 2YA YA Latest 4 weeks 4YA 3YA 2YA YA Latest 52 weeks Source: Circana, Integrated Fresh, MULO+, 4 weeks and 52 w.e. ending 12/29/2024 versus same periods the past four years 5
Mushroom contribution to the department and category This quad-week period has an above-average share of dollars compared to the rest of the week 4 weeks Mushroom $ share Share of total produce Share of total vegetables 52 weeks Mushroom $ share Share of total produce Share of total vegetables 3YA 3YA 2.2% 4.1% 2.0% 4.0% 2YA 2YA 2.1% 4.1% 1.9% 3.9% YA YA 2.0% 3.7% 1.8% 3.7% 4 w.e. 12/29/2024 52 w.e. 12/29/2024 1.9% 3.7% 1.7% 3.5% Source: Circana, Integrated Fresh, MULO+, 4 weeks and 52 w.e. ending 12/29/2024 6
Mushrooms price per unit On a per unit basis, total produce experienced a bit of inflation this quad week, driven by vegetables. In contrast, mushroom prices decreased 4 weeks Average price/unit Total produce Total vegetables Mushrooms 3YA $2.57 $2.28 $2.93 2YA $2.71 $2.48 $3.15 YA $2.75 $2.43 $3.13 4 w.e. 12/29/2024 $2.77 | +0.7% $2.46 | +1.2% $3.08 | -1.6% Source: Circana, Integrated Fresh, MULO+, YTD weeks ending 12/29/2024 7
Mushroom price per volume (pound) On a per pound basis, mushrooms were also the exception with a 1.3% year-over- year increase during the quad-week, versus increases for vegetables and total produce 4 weeks Average price/pound Total produce Total vegetables Mushrooms 3YA $1.81 $1.83 $4.33 2YA $1.91 $1.97 $4.60 YA $1.92 $1.92 $4.56 4 w.e. 12/29/2024 $1.95 | +1.3% $1.96 | +1.8% $4.50 | -1.3% Source: Circana, Integrated Fresh, MULO+, YTD weeks ending 12/29/2024 8
Price per volume by quarter/month Q4 prices were the lowest of the year, albeit a mere few cents per pound Mushrooms price per pound and change vs. YA (fixed and random weight) $4.70 10.0% $4.52 $4.57 $4.53 $4.48 $4.51 $4.54 $4.56 $4.54 $4.56 $4.53 $4.50 $4.60 $4.44 8.0% $4.50 $4.33 $4.40 6.0% $4.30 7.9% 7.9% $4.09 $4.18 6.4% $4.20 5.2% 4.0% 4.5% $4.10 $3.95 3.5% $4.00 2.0% $3.90 2.1% 1.0% 1.3%1.0% $3.80 0.0% 0.7% $3.70 -0.1% -0.5% -1.3% -2.0% 4 w.e. 12/29/24 -0.8% Q4 23 $3.60 2019 2020 2021 Q1 22 Q2 22 Q3 22 Q4 22 Q1 23 Q2 23 Q3 23 Q1 24 Q2 24 Q3 24 Q4 24 Source: Circana, Integrated Fresh, MULO+, 2019-w.e. 12/29/2024 9
Price by type 4 w.e.12/29/2024 Price per unit % change vs. YA $3.08 Total mushrooms -1.6% $2.73 White mushrooms -1.3% $3.47 Crimini mushrooms -1.6% $2.55 Portabella mushrooms -5.5% $5.78 Specialty mushrooms +1.8% 4 w.e. 12/29/2024 Price per volume % change vs. YA Total mushrooms $4.50 -1.3% White mushrooms $3.98 -1.6% Crimini mushrooms $4.56 -0.9% Portabella mushrooms $5.10 -4.8% Specialty mushrooms $13.74 -0.2% Specialty mushrooms include shiitake, oyster, enoki, chanterelle, morel, wood ear, porcini, black forest, lion s mane and other Source: Circana, Integrated Fresh, MULO+, 4 w.e. 12/29/2024 10
Mushroom dollar, unit, volume sales The quad-week was impacted by the date cut-off and showed larger declines than we have seen in recent months 4 w.e. 12/29/2024 dollars $121.0M -4.8% -3.3% -3.6% Dollar Unit Volume growth vs. YA growth vs. YA growth vs. YA volume (lbs) 26.9M -6.5% vs. 3YA -10.0% vs. 3YA -7.0% vs. 3YA Source: Circana, Integrated Fresh, MULO+, 4 weeks ending 12/29/2024 11
Vegetables and mushroom pound sales vs. YA Vegetables had an off quad-week as well. Gains had been trending around 2% year-on- year, but dropped to +0.5% for quad-week 13. Volume (pound) sales versus year ago Fresh vegetables vs YA Fresh mushrooms vs. YA 19.0% 15.5% 3.9% 2.8% 2.2% 1.6% 1.3% 1.0% 0.5% 0.3% -0.7% -1.2% -2.3% Q3 '22 -1.0% Q2 '22 2020 2021 Q1 '22 Q4 '22 Q1 '23 Q2 '23 Q3 '23 Q4 '23 Q1 '24 Q2 '24 Q3' 24 Q4 '24 4 w.e. 12/29/24 -1.4% -1.6% -2.0% -2.1% -3.6% -2.9% -4.4% -5.2% -4.6% -4.0% -2.5% -4.8% -4.8% -7.3% -9.1% -8.6% Source: Circana, Integrated Fresh, MULO+, 2020 -w.e. 12/29/2024 12
Share of dollars sold on merchandising Promotional levels increased during the past four weeks, likely due to the Thanksgiving promotions Fresh mushrooms 4 w.e. Vs. YA Latest 52 w.e. 12/29/2024 Vs. YA 12/29/2024 Share of dollars sold on promotion 18.0% +15.6% 18.0% +3.8% * Any merchandising, including feature, display, feature & display and temporary price reductions Source: Circana, Integrated Fresh, MULO+, latest 4 w.e. 12/29/2024 13
Over indexing versus under indexing regions Two regions substantially pulled down volume sales during this quad week, being the Northeast and the Southeast. Pound sales in the Great Lakes were mostly flat Use as comparison to understand importance/size of mushrooms L-4 w.e. 12/29/2024 Share of veg. lbs Share of mushroom lbs lbs sales WEST WEST PLAINS PLAINS growth vs. YA GREAT LAKES GREAT LAKES Total US California Great Lakes Mid-South Northeast Plains South Central Southeast West 100.0% 10.8% 100.0% 12.7% -3.6% -2.3% NORTHEAST NORTHEAST 14.4% 14.8% -0.4% 13.4% 11.5% -3.0% MID SOUTH MID SOUTH 15.8% 19.0% -5.9% 7.0% 6.5% -1.1% 10.6% 7.0% -2.6% CALIFORNIA CALIFORNIA SOUTHEAST SOUTHEAST 15.2% 14.4% -8.2% 12.8% 14.2% -1.8% SOUTH CENTRAL SOUTH CENTRAL = Above-average share vs. veg = Above-average performance vs. total US Source: Circana, Integrated Fresh, MULO+, L52 w.e. 12/29/2024 | Total fresh vegetables and total fresh mushrooms 14
Performance summary whites, browns and specialty Where crimini mushrooms have had the better performance, whites did better this quad week, due to light mushroom users coming into the category for the holidays. 4 weeks ending 12/29/2024 Dollar share $ sales vs. YA $ sales vs. 2YA Volum e (lbs) Lbs Lbs Lbs vs. 2YA Dollars share vs. YA $121.0M 100.0% -4.8% -6.5% 26.9M 100.0% -3.6% -10.0% Total fresh mushrooms $59.9M 49.5% -5.0% -10.5% 15.1M 56.1% -3.5% -13.6% White mushrooms $43.2M 35.7% -5.6% +1.1% 9.5M 35.3% -4.8% -2.4% Crimini mushrooms $8.5M 7.0% -1.9% -26.9% 1.7M 6.2% +3.1% -21.5% Portabella mushrooms $8.0M 6.7% -1.0% +18.2% 0.6M 2.2% -0.9% +16.6% Specialty mushrooms Source: Circana, Integrated Fresh, MULO+, 4 weeks ending 12/29/2024 15
Other insights Packaged (fixed weight) versus random weight Package-size analysis Organic versus conventional Value-added versus whole/uncut 16
Package size analysis 8-ounce packs drove the bulk of sales but 24-ounce packages have overtaken 16-ounce packages. The 24-ounce had been driving unit and volume growth, but this was also an off week for these large packages Package size (per UPC) 4 weeks Dollars $ vs. YA Units % vs. YA Volume lbs vs. YA 8 OZ $55.9M -4.8% 24.1M -1.4% 12.0M -1.4% 16 OZ $18.9M -6.6% 4.6M -8.0% 4.6M -8.0% 24 OZ $21.4M +0.1% 4.1M -1.8% 6.2M -1.8% Source: Circana, Integrated Fresh, MULO+, 4 weeks ending 12/29/2024 17
Packaged (fixed weight) versus random weight Fixed-weight dollar sales outperformed random weight 4 w.e. 12/29/2024 | Share of total mushroom sales and sales growth % Fixed weight Random weight Dollar growth -4.6% -7.5% Share of mushroom $ sales 96.6% -3.5% 3.4% -4.4% Volume growth Share of mushroom lbs sales 97.0% 3.0% Source: Circana, Integrated Fresh, MULO+, 4 weeks ending 12/29/2024 18
Organic versus conventional mushrooms sales Organic mushrooms increased volume sales with a shift to larger pack sizes 4 w.e. 12/29/2024 | Share of total mushroom sales and sales growth % Unit growth -4.1% Volume growth -5.2% Market size $93.0M $ Conventional growth -6.6% Unit growth +1.2% Volume growth +3.2% Market size $27.9M $ Organic growth +1.6% Source: Circana, Integrated Fresh, MULO+, 4 weeks ending 12/29/2024 compared with year ago 19
Value added versus whole mushrooms Whole outperformed value-added mushrooms 4 w.e. 12/29/2024 | Share of total mushroom sales and sales growth % Unit growth -1.1% Volume growth -2.5% Market size $73.9M $ Whole growth -3.1% Unit growth -6.4% Volume growth -5.4% Market size $47.1M $ growth -7.3% Value-added Source: Circana, Integrated Fresh, MULO+, 4 weeks ending 12/29/2024 compared with year ago 20


 sales trend")


")


 versus random weight")