From Natural Images to MRIs: Using TDA to Analyze Image Data
Analyze image data using topological methods in brain network analysis. Explore the transition from natural images to MRIs and the application of TDA on image datasets. Presented by Maria Gommel of University of Iowa on May 10, 2017.

Download Presentation

Please find below an Image/Link to download the presentation.
The content on the website is provided AS IS for your information and personal use only. It may not be sold, licensed, or shared on other websites without obtaining consent from the author.If you encounter any issues during the download, it is possible that the publisher has removed the file from their server.
You are allowed to download the files provided on this website for personal or commercial use, subject to the condition that they are used lawfully. All files are the property of their respective owners.
The content on the website is provided AS IS for your information and personal use only. It may not be sold, licensed, or shared on other websites without obtaining consent from the author.
E N D
Presentation Transcript
From Natural Images to MRIs: Using TDA to Analyze Image Data Maria Gommel, University of Iowa Topological Methods in Brain Network Analysis May 10, 2017
Motivation vs. Natural Image from van Hateren and van der Schaaf dataset Slice of fMRI image from Nopoulos Lab (University of Iowa)
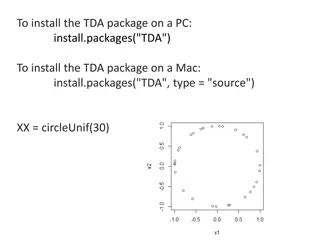
Results on Natural Images 0 1 9.532e 19 1.483e 17 3.744e 17 11.807e 17 0.048 0.703 0.703 0.084 0.5 1 0.5 0 0.5 0 1 9 8 Extract 3x3 pixel patches from the images (natural image) Create a vector corresponding to the greyscale value of each pixel Normalize intensity, extract high contrast patches, and normalize contrast Gunnar Carlsson, Tigran Ishkhanov, Vin de Silva, and Afra Zomorodian. On the local behavior of spaces of natural images. International Journal of Computer Vision, 76(1):1 12, 2008.
Results on Natural Images Barcode (dimension 1) for the top 30% densest patches, where density is measured using KNN, k = 15 Images from Carlsson stalk Topological Methods for Large and Complex Data Sets , 2012. https://www.ima.umn.edu/materials/2011-2012/W3.26-30.12/11925/imamachinefinal.pdf
Results on Natural Images Images from Carlsson stalk Topological Methods for Large and Complex Data Sets , 2012. https://www.ima.umn.edu/materials/2011-2012/W3.26-30.12/11925/imamachinefinal.pdf
Results on Natural Images Image from http://www.math.union.edu/~dpvc/papers/rp2/Glo ssary/KleinBottle.html Image from Robert Ghrist, Barcodes: The Persistent Topology of Data
Toy Problem: Apply same ideas to fMRI image Our data is three-dimensional We fix one slice, and extract patches from this slice from each patient
Initial Results fMRI Data Projection of the data onto the first two coordinates Barcode (dimension 1) using K- means to find centroids, then using the Rips complex Barcode (dimension 1) using the witness complex Results from the 30% densest points, where density is measured using kNN with k = 15
There is much more we could do Find which patches form the circle. Then, look for the placement of these patches in the original image. What are the other structures that appear in the projection? Use 3x3x3 pixel cubes instead of 3x3 squares.
but we have many questions. Are we using the correct data for this analysis? The data we ve been using are seed-derived network maps . What would our results mean in this context? Would the results be useful? Unseeded, 4-dimensional data is also available, but adds another layer of complexity. Are these methods appropriate for fMRI data? Natural images and MRIs are very different in many ways. Should we use patches and other image processing techniques on fMRI data?
Questions? If you have ideas or comments about this project, please share them with me! I d very much appreciate it.
Initial Results replication of natural images Projection of the data onto the first two coordinates Barcode (dimension 1) using K- means to find centroids, then using the Rips complex Barcode (dimension 1) using the witness complex Results from the 30% densest points, where density is measured using kNN with k = 15