Full-Scale Spectrum of Boundary Layer Wind: Insights from Data Analysis
Studying the full-scale spectrum of boundary layer wind using extensive meteorological and sonic data from various sites reveals insights into spectral behaviors at different scales. This analysis aids in building robust models and understanding the crucial spectral gap between 2D and 3D atmospheric motions, essential for turbulence measurements and model parameterization.

Download Presentation

Please find below an Image/Link to download the presentation.
The content on the website is provided AS IS for your information and personal use only. It may not be sold, licensed, or shared on other websites without obtaining consent from the author.If you encounter any issues during the download, it is possible that the publisher has removed the file from their server.
You are allowed to download the files provided on this website for personal or commercial use, subject to the condition that they are used lawfully. All files are the property of their respective owners.
The content on the website is provided AS IS for your information and personal use only. It may not be sold, licensed, or shared on other websites without obtaining consent from the author.
E N D
Presentation Transcript
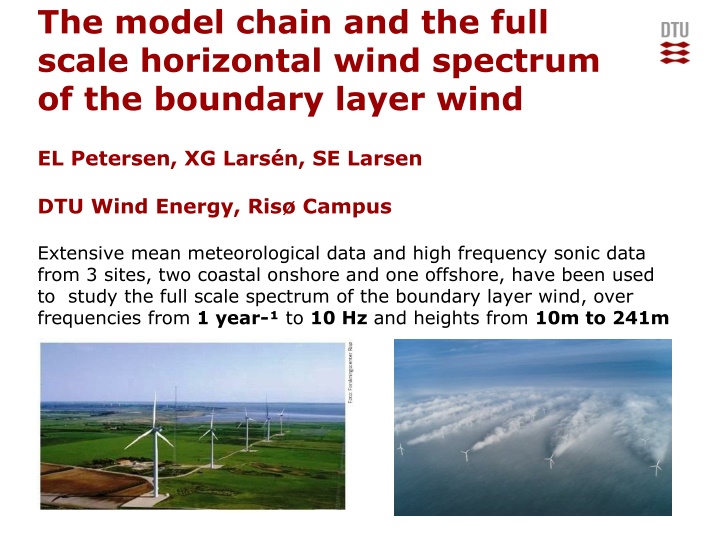
The model chain and the full scale horizontal wind spectrum of the boundary layer wind EL Petersen, XG Lars n, SE Larsen DTU Wind Energy, Ris Campus Extensive mean meteorological data and high frequency sonic data from 3 sites, two coastal onshore and one offshore, have been used to study the full scale spectrum of the boundary layer wind, over frequencies from 1 year- to 10 Hz and heights from 10m to 241m
Why is it interesting to study the spectrum for the Model Chain? The understanding of the physics of the spectral behaviours at different scales and the scale separation can guide us in building the models constituting the Model Chain. A very important aspect of the full scale spectrum is the (possible) existence of a spectral gap between the 2D and the 3D atmospheric motions. The spectral gap is essential for obtaining turbulence quantities through measurements and for the their use in the microscale models and the parameterization of the subscale processes in the mesoscale models. The spectral gap ensures that measured turbulence (can) fulfils the criteria of ergodicity and stationarity.
In recent paper published in Boundary Layer Meteorology - we present: 1) summary of the history of the Gap and its importance 2) New analyses being made possible by new data and analysis technology 3) New models for the characteristics of the gap, validated by the data. These new models are shown in this presentation.
NEW EUROPEAN WIND ATLAS MODEL CHAIN EXPERIMENTS DATABASE Input for models and experiments Reanalysis data Meso scale - Complex terrain - Forest - Offshore - Coastal - Wakes Micro scale Orography Topography - Land use & roughness - Cities & environment Model interface - Open platform Verification & Validation Models of uncertainty Model runs Exp . Database Wind data & Design Param. Speedup, Extremes, Turbulence, Icing conditions, Offshore waves, etc. Deliverables in the new European Wind Atlas 4 WindEurope Summit 2016
TERRA INCOGNITA (the nightmare of model chain modelers) The figure shows the grids size, , for meso scale and LES models relative to the turbulence spectrum, according to (Wyngaard, 2004)
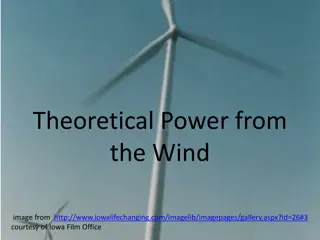
Van der Hoven spectrum Wishful thinking but fundamental to classical atmospheric turbulence theory (M-O scaling) fS(f) f
Measurements: sterild, Hvsre and Horns Rev Land sterild Coast H vs re Offshore Horns Rev
Spectral behaviours: Variation with height and geographical location of the full scale boundary layer horizontal wind spectrum and the spectral gap between meso scale and micro scale 8 WindEurope Summit 2016
Horns Rev 10 min 1 min 1 s 1 Y 1 M 1 D 1 H 5 45 m 1 f S(f) m2s-2 fS(f) m2s-2 0.1 0.01 2002 10-min data 2000-2002 10-min data 1999 - 2006 good months tur data 0.001 -6 -5 -4 -3 -2 -1 0 1 10 10 10 10 f Hz 10 10 10 10 Spectra of wind speed at 45 m at Horns Rev, from 1 year 10-min mean values and from day-long 20 and 12 HZ time series f Hz 9 WindEurope Summit 2016
Hvsre a b 10 min 1 min 1 s 10 min1 min 1 s 1 Y 1 M 1 D 1 H 1 Y 1 M 1 D 1 H 5 5 1 10 m 1 80 m fS(f) m2s-2 fS(f) m2s-2 0.1 0.1 0.01 0.01 10 m 80 m f S(f) m2s-2 0.001 0.001 -8 -7 -6 -5 -4 -3 -2 -1 0 -8 -7 -6 -5 -4 -3 -2 -1 0 10 10 10 10 10 10 10 10 10 10 10 10 10 10 10 10 10 10 f Hz f Hz c 10 min 1 min 1 s 1 Y 1 M 1 D 1 H 5 2012 10-min data 10-year 10-min data tur data 1 100 m fS(f) m2s-2 0.1 0.01 100 m Spectra of wind speed at 3 heights at H vs re, from 1 year 10-min mean values and from day-long 20 HZ time series 0.001 -8 -7 -6 -5 -4 -3 -2 -1 0 10 10 10 10 10 10 10 10 10 f Hz f Hz 10 WindEurope Summit 2016
sterild 241 m H 1 10 min 1 min 1 s 175 m 1 Y 1 1 1 M 1 D 10 10 0 0 10 10 fS(f) m2s-2 fS(f) m2s-2 -1 -1 10 10 241 m -2 -2 175 m 10 10 -3 -3 10 10 -710 -610 -510 -410 f Hz 103 m -310 -210 -110 010 1 -710 -610 -510 -410 f Hz 37 m -310 -210 -110 010 1 10 10 1 1 10 10 0 0 f S(f) m2s-2 10 10 fS(f) m2s-2 fS(f) m2s-2 -1 -1 10 10 -2 -2 103 m 37 m 10 10 -3 -3 10 10 -710 -610 -510 -410 f Hz 7 m -310 -210 -110 010 1 -710 -610 -510 -410 f Hz -310 -210 -110 010 1 10 10 1 10 0 10-min sonic 20-Hz sonic 10 fS(f) m2s-2 -1 10 Spectra of wind speed at 5 heights at sterild, from 1 year 10-min mean values and from day-long 20 HZ time series 7 m -2 10 -3 10 -710 -610 -510 -410 f Hz f Hz -310 -210 -110 010 1 10 11 WindEurope Summit 2016
Hvsre Simple Genesis model for Total Wind Spectrum in Gap region, z=10m Eq.1 : Total horizontal wind spectrum at 10 m, composed by the extrapolation of the low frequency form and a Kaimal- shape fitted to the peak for the ABL spectrum.
Hvsre Simple Genesis model for Total Wind Spectrum for z = 80, 100m Total Horizontal wind spectrum at 80 m, composed by the extrapolation of the low frequency form and a Kaimal- shape fitted to the peak for the ABL spectrum. Eq.1 :
sterild 241 m 175 m 37 m 14 WindEurope Summit 2016
Spectral behaviours: Diurnal Peak The daily variation of the wind changes with height and is a strong stability measure. The spectral component S(f)|f=1 day-1is studied in the next figures 15 WindEurope Summit 2016
(a) Spectra of wind speed at 5 heights at sterild, from 1 year 10-min sonic data time series (dashed curves) and from day-long 20 Hz sonic time series (solid curves). Note 7 m is most likely sheltered by a surrounding forest. a b 10 min 1 min 1 s 1 Y 1 M 1 D 1 H 1 10 (b) Spectra of wind speed at 6 heights at H vs re (c) Spectra of wind speed at 4 heights at Horns Rev 10 1 1 241 m 175 m 103 m 37 m 7 m 10 10 a 0 0 0 10 10 10 sterild a b fS(f) m2s-2 fS(f) m2s-2 1 1 10 fS(f) m2s-2 -1 10 -1 -1 10 10 0 0 10 10 fS(f) m2s-2 fS(f) m2s-2 H vs re Horns Rev -1 Points at 1/day -2 -1 10 10 10 -2 -2 10 10 -6 -5 -4 -3 -6 -5 -4 -3 10 10 10 10 10 10 10 10 H vs re Horns Rev f Hz f Hz -2 -2 10 10 -3 10 -6 -5 -4 -3 -6 -5 -4 -3 10 10 10 0 10 10 10 10 10 10 -7 -6 -5 -4 -3 -2 -1 1 10 10 10 10 10 10 10 10 f Hz f Hz f Hz a b a b 10 m 40 m 60 m 80 m 100 m 116.5 m 1:1 slope 1 1 10 10 1 1 10 10 10 m 40 m 60 m 80 m 100 m 116.5 m 1:1 slope 15 m 30 m 45 m 62 m 1:1 slope 15 m 30 m 45 m 62 m 1:1 slope 0 0 0 0 10 10 10 10 fS(f) m2s-2 fS(f) m2s-2 fS(f) m2s-2 fS(f) m2s-2 -1 -1 -1 -1 10 10 10 10 c b H vs re Horns Rev H vs re Horns Rev -2 -2 -2 -2 10 -6 10 10 10 10 -6 -5 -4 -3 -3 -6 10 -5 10 -4 -3 -5 -4 -6 -5 -4 -3 10 f Hz 10 10 10 10 10 10 10 10 10 10 10 10 f Hz f Hz WindEurope Summit 2016 f Hz 16 10 m 40 m 60 m 80 m 100 m 116.5 m 1:1 slope 10 m 40 m 60 m 80 m 100 m 116.5 m 1:1 slope 15 m 30 m 45 m 62 m 1:1 slope 15 m 30 m 45 m 62 m 1:1 slope
Variation of S(f)|f=1 day-1( the daily cycle of the wind speed) with height. m Height 250 200 sterild H vs re 150 Horns Rev 100 50 0 S(f)|f=1 day-1 17 WindEurope Summit 2016
Conclusion. One of the intentions of our analysis has been to aid the work with the New European Wind Atlas with regard to: 1. Building the Model Chain. The analysis of the full scale horizontal wind speed spectrum and the spectral gap it should be useful for the work with resolution issues and closure developments for the numerical models. 2. The measurement campaigns. The structure around the gap may be used for specifying the necessary (natural) time windows for measuring turbulence characteristics. Specific results The full spectrum can be considered a linear composite of PBL turbulence and mesoscale , 3D and 2D The Gap is clearly present at lower heights and at heights where it is almost non-visible it can be recovered assuming that the meso scale and the PBL turbulence is uncorrelated.


 Spectra of wind speed at 5 heights at Østerild, from 1")
|f=1 day-1( the daily cycle of the")