Fundamentals of Biostatistics: Key Concepts in Research Design
This educational series delves into essential topics such as variables, statistical power, scale distinctions, and parametric vs. non-parametric tests. Learn about independent vs. dependent variables, continuous dependent variables, and the differences between parametric and non-parametric tests. Gain insights into predictor variables, outcome measures, and how variables interact within a study context.

Download Presentation

Please find below an Image/Link to download the presentation.
The content on the website is provided AS IS for your information and personal use only. It may not be sold, licensed, or shared on other websites without obtaining consent from the author.If you encounter any issues during the download, it is possible that the publisher has removed the file from their server.
You are allowed to download the files provided on this website for personal or commercial use, subject to the condition that they are used lawfully. All files are the property of their respective owners.
The content on the website is provided AS IS for your information and personal use only. It may not be sold, licensed, or shared on other websites without obtaining consent from the author.
E N D
Presentation Transcript
Principles of Research Writing & Design Educational Series Fundamentals of Biostatistics (Part 2) Lauren Duke, MA Program Coordinator Meharry-Vanderbilt Alliance 31 July 2015
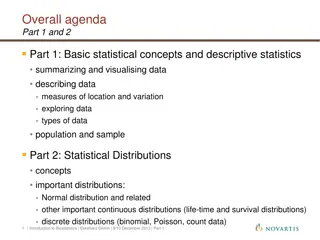
Session Outline Overview of variables Independent vs. Dependent variables Two variable tests Continuous dependent variables Pearson Correlation Regression T-tests ANOVAs Categorical dependent variables Chi-square Point biserial correlation Logistic regression
Scale Nominal Characteristic Is A different than B? (Not Ordered) Examples Marital Status Eye Color Gender Race Statistical Power Low Categorical Ordinal Is A bigger than B? (Ordered) Stage of Disease Severity of Pain Level of Satisfaction Temperature SAT Score Distance Length Time until Death Weight Intermediate Interval By how many units do A and B differ? How many times bigger is B than A? High Continuous Ratio High Scale Counting Ranking Addition/ Subtraction Multiplication/ Division x x x x Nominal x x x Ordinal Interval x Ratio x x
Parametric vs. Non-parametric Tests Parametric Normal Homogeneous Ratio or Interval Mean Can draw more conclusions Non-parametric Any Any Ordinal or Nominal Median Simplicity Assumed distribution Assumed variance Typical data Usual central measure Benefits Tests Correlation Independent measures, 2 groups Independent measures, >2 groups Pearson Independent-measures t-test One-way, independent-measures ANOVA Matched pair t-test One-way, repeated measures ANOVA Spearman Mann-Whitney test Kruskal-Wallis test Repeated measures, 2 conditions Repeated measures, >2 conditions Wilcoxon test Friedman s test
Independent vs. Dependent Variables Independent Dependent Predictors Outcomes or criterions Is not changed by the other variables you are trying to measure Depends on the independent variable How is the variable (hopefully) affected by the independent variable during the study
Continuous Dependent Variables
One Continuous Outcome One One Categorical Predictor Continuous Predictor Two More than Two Categories Categories Same Different Different Same Pearson correlation or regression Dependent t-test Repeated Measures ANOVA Independent t-test Independent ANOVA
Pearson Correlation 1 continuous dependent variable 1 continuous independent variable Nonparametric equivalent: Spearman Correlation does NOT imply causation
Linear Regression Shows the relationship between two variables How one changes at varied levels of the other One continuous dependent variable - outcome One continuous independent variable - predictor Can infer causal relationships
One Continuous Outcome One One Categorical Predictor Continuous Predictor Two More than Two Categories Categories Same Different Different Same Pearson correlation or regression Dependent t-test Repeated Measures ANOVA Independent t-test Independent ANOVA
t-tests Independent t-test One continuous dependent variable Dependent t-test (Paired samples) One continuous dependent variable Nonparametric equivalent: Wilcoxon-Mann-Whitney test Nonparametric equivalent: Wilcoxon Signed Rank test One Categorical Independent variable with two categories One categorical variable with two categories The values in one sample have no affect on the values in another sample The values in one sample affect values in another sample Placebo
ANOVA Analysis of Variance Compare group means and the variation among or between groups One continuous dependent variable One categorical independent variable More than two categories
One-way ANOVA Independent Repeated measures Also known as within groups Also known as between groups Nonparametric equivalent = Kruskal Wallis Nonparametric equivalent: Friedman Analysis of Variance by Ranks Start 3 months 6 months Finish
Categorical Dependent Variables
One Categorical Outcome One One Categorical Predictor Continuous Predictor Different Logistic regression or point biserial correlation Pearson chi-square
Chi-Square How likely is it the difference between the two variables happened by chance? Nonparametric equivalent: Fisher exact test Goodness of fit Does you frequency distribution differ from a theoretical distribution? Independence of observations Are your observations on two variables independent from each other? One Categorical Dependent variable One Categorical Independent variable
Point biserial Correlations 1 categorical variable dichotomous 1 continuous variable Correlation does NOT imply causation A point biserial correlation is denoted as rpb
Logistic Regression Shows the relationship between two variables How one changes at varied levels of the other One categorical dependent variable - outcome One continuous independent variable - predictor Can infer causal relationships Example: Does amount of exercise determine blood pressure?
Type of Independent Variable Type of Dependent Variable Test interval & normal 2 independent sample t-test 1 IV with 2 levels (independent groups) ordinal or interval Wilcoxon-Mann Whitney test nominal interval & normal ordinal or interval Chi-square test one-way ANOVA Kruskal Wallis 1 IV with 2 or more levels (independent groups) nominal Chi-square test interval & normal paired t-test 1 IV with 2 levels (dependent/matched groups) ordinal or interval Wilcoxon signed ranks test interval & normal one-way repeated measures ANOVA 1 IV with 2 or more levels (dependent/matched groups) ordinal or interval Friedman test interval & normal correlation interval & normal simple linear regression 1 interval IV ordinal or interval non-parametric correlation nominal simple logistic regression
Session Schedule All sessions held at the MVA from 12pm-1pm Date June 19 Literature Reviews & Grants 101 June 26 Writing a Scientific Manuscript (Part 1) July 10 Writing a Scientific Manuscript (Part 2) July 17 Fundamentals of Study Design July 24 Fundamentals of Biostatistics (Part 1) July 31 Fundamentals of Biostatistics (Part 2) Topic To RSVP call (615) 963-2820 or email mva@Meharry-Vanderbilt.org