Fundamentals of Project Management

Project Management encompasses planning, directing, and controlling resources to achieve project objectives. Learn about project work breakdown structures, critical path scheduling, and more to effectively manage projects. Explore the advantages and disadvantages of pure and functional project structures. Gain insights into Gantt charts and operations management.

Download Presentation

Please find below an Image/Link to download the presentation.
The content on the website is provided AS IS for your information and personal use only. It may not be sold, licensed, or shared on other websites without obtaining consent from the author.If you encounter any issues during the download, it is possible that the publisher has removed the file from their server.
You are allowed to download the files provided on this website for personal or commercial use, subject to the condition that they are used lawfully. All files are the property of their respective owners.
The content on the website is provided AS IS for your information and personal use only. It may not be sold, licensed, or shared on other websites without obtaining consent from the author.
E N D
Presentation Transcript
Outline Definition of Project Management Work Breakdown Structure Project Control Charts Structuring Projects Critical Path Scheduling By Hand Linear Programming PERT By Hand Operations -- Prof. Juran 2
Project Management A Project is a series of related jobs usually directed toward some major output and requiring a significant period of time to perform Project Management is the set of management activities of planning, directing, and controlling resources (people, equipment, material) to meet the technical, cost, and time constraints of a project An extreme case: Smallest possible production volume, greatest possible customization
A pure project is where a self-contained team works full-time on the project Advantages: The project manager has full authority over the project Team members report to one boss Shortened communication lines Team pride, motivation, and commitment are high Disadvantages: Duplication of resources Organizational goals and policies are ignored Lack of technology transfer Team members have no functional area "home"
Functional Projects President Research and Development Engineering Manufacturing Project A Project B Project C Project D Project E Project F Project G Project H Project I Example: Project B is in the functional area of Research and Development.
Functional Projects Advantages: A team member can work on several projects Technical expertise is maintained within the functional area The functional area is a home after the project is completed Critical mass of specialized knowledge Disadvantages: Aspects of the project that are not directly related to the functional area get short-changed Motivation of team members is often weak Needs of the client are secondary and are responded to slowly
Matrix Project Organization Structure President Research and Development Engineering Marketing Manufacturing Manager Project A Manager Project B Manager Project C
Matrix Structure Advantages: Enhanced communications between functional areas Pinpointed responsibility Duplication of resources is minimized Functional home for team members Policies of the parent organization are followed Disadvantages: Too many bosses Depends on project manager s negotiating skills Potential for sub-optimization
Work Breakdown Structure A hierarchy of project tasks, subtasks, and work packages Level Program 1 Project 1 Project 2 2 Task 1.1 Task 1.2 3 Subtask 1.1.1 Subtask 1.1.2 4 Work Package 1.1.1.1 Work Package 1.1.1.2
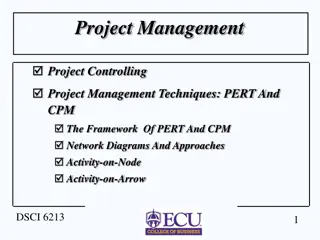
Network Models A project is viewed as a sequence of activities that form a network representing a project The path taking longest time through this network of activities is called the critical path The critical path provides a wide range of scheduling information useful in managing a project Critical Path Method (CPM) helps to identify the critical path(s) in the project network
Prerequisites for Critical Path Method A project must have: well-defined jobs or tasks whose completion marks the end of the project; independent jobs or tasks; and tasks that follow a given sequence.
Types of Critical Path Methods CPM with a Single Time Estimate Used when activity times are known with certainty Used to determine timing estimates for the project, each activity in the project, and slack time for activities Time-Cost Models Used when cost trade-off information is a major consideration in planning Used to determine the least cost in reducing total project time CPM with Three Activity Time Estimates Used when activity times are uncertain Used to obtain the same information as the Single Time Estimate model and probability information
CPM with Single Time Estimate 1. Activity Identification 2. Activity Sequencing and Network Construction 3. Determine the critical path From the critical path all of the project and activity timing information can be obtained
House-Building Example Activity Activity A Activity B Activity C Activity D Activity E Activity F Activity G Description Predecessors A B B B E C, F Duration (days) 5 8 10 5 4 6 3 Build foundation Build walls and ceilings Build roof Do electrical wiring Put in windows Put on siding Paint house Operations -- Prof. Juran 16
Managerial Problems Find the minimum number of days needed to build the house. Find the critical path . Find the least expensive way to finish the house in a certain amount of time. Study the possible effects of randomness in the activity times. Operations -- Prof. Juran 17
Activity-on-Arc Network F 6 1 3 4 G 3 A 5 E 4 C 10 0 5 B 8 Start End D 5 2 Operations -- Prof. Juran 18
Method 1: By Hand F 6 1 3 4 G 3 A 5 E 4 0 C 10 5 B 8 Start End D 5 2 Operations -- Prof. Juran 19
Procedure Draw network Forward pass to find earliest times Backward pass to find latest times Analysis: Critical Path, Slack Times Extensions (really hard!): Crashing PERT Operations -- Prof. Juran 20
CPM Jargon Every network of this type has at least one critical path, consisting of a set of critical activities. In this example, there are two critical paths: A-B-C-G and A-B-E-F-G. F 6 1 3 4 G 3 A 5 E 4 0 5 C 10 Star t B 8 End D 5 2 Operations -- Prof. Juran 21
Conclusions The project will take 26 days to complete. The only activity that is not critical is the electrical wiring (Activity D). Operations -- Prof. Juran 22
Time-Cost Models Basic Assumption: Relationship between activity completion time and project cost Time Cost Models: Determine the optimum point in time-cost tradeoffs Activity direct costs Project indirect costs Activity completion times
Crashing Parameters Cost per Day to Reduce Duration $30 $15 $20 $40 $20 $30 $40 Maximum Possible Reduction (Days) 2 3 1 2 2 3 1 Activity Build foundation Walls and ceilings Build roof Electrical wiring Put in windows Put on siding Paint house What is the least expensive way to finish this project in 20 days? (This is hard!) Operations -- Prof. Juran 24
CPM with Three Activity Time Estimates Activity A B C D E F G Optimistic 3 5 9 3 2 3 2 Most Likely 5 8 10 5 4 6 3 Pessimistic 7 11 11 7 6 9 4 Operations -- Prof. Juran 25
Expected Time Calculations A B C D E F G 1 2 3 4 5 6 7 8 Activity Optimistic Most Likely Pessimistic Expected A 3 5 B 5 8 C 9 10 D 3 5 E 2 4 F 3 6 G 2 3 =(B2+C2*4+D2)/6 7 11 11 7 6 9 4 5 8 10 5 4 6 3 4(Most + Time Opt. Likely Time) + Pess. Time Expected Time = 6 Operations -- Prof. Juran 26
Expected Time Calculations A B C D E F G 1 2 3 4 5 6 7 8 Activity Optimistic Most Likely Pessimistic Expected A 3 5 B 5 8 C 9 10 D 3 5 E 2 4 F 3 6 G 2 3 =(B2+C2*4+D2)/6 7 11 11 7 6 9 4 5 8 10 5 4 6 3 Note: the expected time of an activity is not necessarily equal to the most likely time (although that is true in this problem). Operations -- Prof. Juran 27
F 6 1 3 4 G 3 A 5 E 4 C 10 0 5 B 8 Start End D 5 2 The sum of the critical path expected times is the expected duration of the whole project (in this case, 26 days). Operations -- Prof. Juran 28
What is the probability of finishing this project in less than 25 days? D - TE Z = 2 cp Operations -- Prof. Juran 29
2 Pessimisti c Optimistic = = 2 Estimated Activity Variance 6 A B C D E F G 1 2 3 4 5 6 7 8 Activity Optimistic Most Likely Pessimistic Expected Variance A 3 5 B 5 8 C 9 10 D 3 5 E 2 4 F 3 6 G 2 3 =((D2-B2)/6)^2 7 11 11 7 6 9 4 5 8 10 5 4 6 3 0.4444 1.0000 0.1111 0.4444 0.4444 1.0000 0.1111 Operations -- Prof. Juran 30
Activity Optimistic Most Likely Pessimistic Expected Variance A 3 5 B 5 8 C 9 10 D 3 5 E 2 4 F 3 6 G 2 3 Criticial Path 1 0.444 1.000 Criticial Path 2 0.444 1.000 0.111 7 5 8 0.444 1.000 0.111 0.444 0.444 1.000 0.111 Expected Variance St Dev 11 11 7 6 9 4 10 5 4 6 3 0.444 1.000 0.111 26.000 3.000 1.732 0.111 26.000 1.667 1.291 2 = 3 Sum the variances along the critical path. (In this case, with two critical paths, we ll take the one with the larger variance.) Operations -- Prof. Juran 31
T - D 25 - 26 = Z = - = 0.5774 E 3 2 cp p(Z < -.156) = .438, or 43.8 % (NORMSDIST(-.156) There is a 28.19% probability that this project will be completed in less than 25 days. Operations -- Prof. Juran 32
CPM Assumptions/Limitations Project activities can be identified as entities (there is a clear beginning and ending point for each activity). Project activity sequence relationships can be specified and networked. Project control should focus on the critical path. The activity times follow the beta distribution, with the variance of the project assumed to equal the sum of the variances along the critical path.
Method 2: Excel Solver (Linear Programming) F 6 1 3 4 G 3 A 5 E 4 0 C 10 5 B 8 Start End D 5 2 Operations -- Prof. Juran 34
Procedure Define Decision Variables Define Objective Function Define Constraints Solver Dialog and Options Run Solver Sensitivity Analysis: Critical Path, Slack Extensions: Crashing (not too bad) PERT (need simulation, not Solver) Operations -- Prof. Juran 35
LP Formulation Decision Variables We are trying to decide when to begin and end each of the activities. Objective Minimize the total time to complete the project. Constraints Each activity has a fixed duration. There are precedence relationships among the activities. We cannot go backwards in time. Operations -- Prof. Juran 36
Formulation Decision Variables Define the nodes to be discrete events. In other words, they occur at one exact point in time. Our decision variables will be these points in time. Define ti to be the time at which node i occurs, and at which time all activities preceding node i have been completed. Define t0 to be zero. Objective Minimize t5. Operations -- Prof. Juran 37
Formulation Constraints There is really one basic type of constraint. For each activity x, let the time of its starting node be represented by tjx and the time of its ending node be represented by tkx. Let the duration of activity x be represented as dx. t t d For every activity x, kx jx x it 0 For every node i, Operations -- Prof. Juran 38
Solution Methodology A B C D E F G H I J K L M N O P 1 2 3 4 5 6 7 8 9 10 11 12 13 14 15 16 17 18 =G6 1 F 6 t0 t1 t2 t3 t4 t5 0 1 1 1 3 4 1 1 1 A 5 G 3 E 4 C 10 0 5 B 8 Start End t0 t1 t2 t3 t4 t5 A -1 1 0 B 0 -1 1 C 0 0 -1 D 0 0 -1 E 0 0 -1 F 0 0 0 G 0 0 0 =SUMPRODUCT($B$6:$G$6,B12:G12) D 5 0 0 0 0 1 -1 0 0 0 1 0 0 1 -1 0 0 0 1 0 0 1 1 >= 5 0 >= 8 0 >= 10 0 >= 5 0 >= 4 0 >= 6 0 >= 3 2 Operations -- Prof. Juran 39
Solution Methodology The matrix of zeros, ones, and negative ones (B12:G18) is a means for setting up the constraints. The sumproduct functions in H12:H18 calculate the elapsed time between relevant pairs of nodes, corresponding to the various activities. The duration times of the activities are in J12:J18. Operations -- Prof. Juran 40
Optimal Solution A B C D E F G H I J K L M N O P 1 2 3 4 5 6 7 8 9 10 11 12 13 14 15 16 17 18 26 F 6 1 3 4 t0 t1 t2 t3 t4 t5 0 5 13 17 23 26 A 5 G 3 E 4 0 C 10 5 B 8 Start End t0 t1 t2 t3 t4 t5 A -1 1 0 B 0 -1 1 C 0 0 -1 D 0 0 -1 E 0 0 -1 F 0 0 0 G 0 0 0 D 5 0 0 0 0 1 -1 0 0 0 1 0 0 1 -1 0 0 0 10 >= 10 1 13 >= 5 0 4 >= 4 0 6 >= 6 1 3 >= 3 5 >= 5 8 >= 8 2 Operations -- Prof. Juran 42
CPM Jargon Any activity for which t t d kx jx x is said to have slack time, the amount of time by which that activity could be delayed without affecting the overall completion time of the whole project. In this example, only activity D has any slack time (13 5 = 8 units of slack time). Operations -- Prof. Juran 43
CPM Jargon Any activity x for which = t t d kx jx x is defined to be a critical activity, with zero slack time. Operations -- Prof. Juran 44
Excel Tricks: Conditional Formatting A B C D E F G H I J K L M N O P 1 2 3 4 5 6 7 8 9 10 11 12 13 14 15 16 17 18 26 F 6 1 3 4 t0 t1 t2 t3 t4 t5 0 5 13 17 23 26 A 5 G 3 E 4 0 C 10 5 B 8 Start End t0 t1 t2 t3 t4 t5 A -1 1 0 B 0 -1 1 C 0 0 -1 D 0 0 -1 E 0 0 -1 F 0 0 0 G 0 0 0 D 5 0 0 0 0 1 -1 0 0 0 1 0 0 1 -1 0 0 0 10 >= 10 1 13 >= 5 0 4 >= 4 0 6 >= 6 1 3 >= 3 5 >= 5 8 >= 8 2 Operations -- Prof. Juran 45
Critical Activities: Using the Solver Answer Report Constraints Cell $H$12 A $H$13 B $H$14 C $H$15 D $H$16 E $H$17 F $H$18 G Name Cell Value Formula Status Slack 5 $H$12>=$J$12 Binding 8 $H$13>=$J$13 Binding 10 $H$14>=$J$14 Binding 13 $H$15>=$J$15 Not Binding 4 $H$16>=$J$16 Binding 6 $H$17>=$J$17 Binding 3 $H$18>=$J$18 Binding 0 0 0 8 0 0 0 Operations -- Prof. Juran 46
House-Building Example, Continued Suppose that by hiring additional workers, the duration of each activity can be reduced. Use LP to find the strategy that minimizes the cost of completing the project within 20 days. Operations -- Prof. Juran 47
Crashing Parameters Cost per Day to Reduce Duration $30 $15 $20 $40 $20 $30 $40 Maximum Possible Reduction (Days) 2 3 1 2 2 3 1 Activity Build foundation Walls and ceilings Build roof Electrical wiring Put in windows Put on siding Paint house Operations -- Prof. Juran 48
Managerial Problem Definition Find a way to build the house in 20 days. Operations -- Prof. Juran 49
Formulation Decision Variables Now the problem is not only when to schedule the activities, but also which activities to accelerate. (In CPM jargon, accelerating an activity at an additional cost is called crashing .) Objective Minimize the total cost of crashing. Operations -- Prof. Juran 50