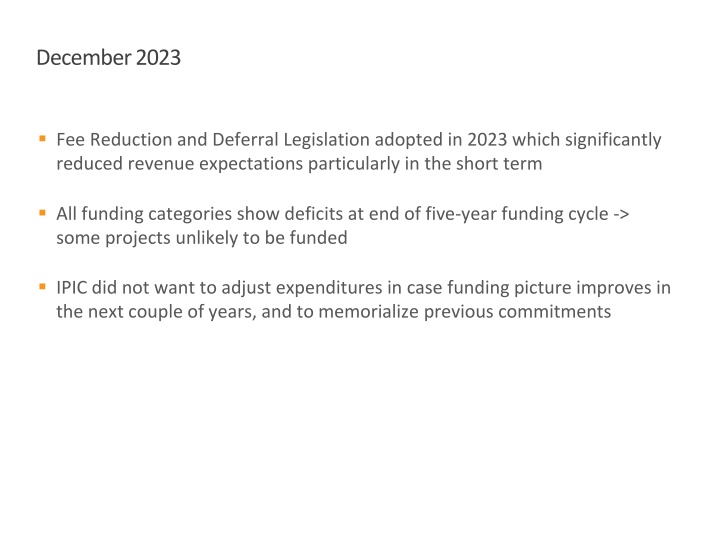
Funding Challenges and Project Status Update in December 2023
The Fee Reduction and Deferral Legislation in 2023 led to reduced revenue expectations, causing deficits in all funding categories. This has raised concerns about the funding of certain projects. Despite the challenges, the IPIC has chosen not to adjust expenditures in the hope of improved funding in the future and to honor previous commitments. The list of funded projects and those awaiting funding provides an insight into the current financial landscape.

Download Presentation

Please find below an Image/Link to download the presentation.
The content on the website is provided AS IS for your information and personal use only. It may not be sold, licensed, or shared on other websites without obtaining consent from the author. If you encounter any issues during the download, it is possible that the publisher has removed the file from their server.
You are allowed to download the files provided on this website for personal or commercial use, subject to the condition that they are used lawfully. All files are the property of their respective owners.
The content on the website is provided AS IS for your information and personal use only. It may not be sold, licensed, or shared on other websites without obtaining consent from the author.
E N D
Presentation Transcript
December 2023 Fee Reduction and Deferral Legislation adopted in 2023 which significantly reduced revenue expectations particularly in the short term All funding categories show deficits at end of five-year funding cycle -> some projects unlikely to be funded IPIC did not want to adjust expenditures in case funding picture improves in the next couple of years, and to memorialize previous commitments
MO Expenditures Projects funded to date Market Octavia Category IPIC NO. Project Agency Amount Transferred Category IPIC NO. Project Agency Amount Transferred Transit 2 Haight Two-way Transportation and Streetscape MTA $ 330,000 Complete Streets 30 Upper Market Pedestrian Improvements DPW $ 2,088,157 Transit 3 Muni Forward MTA $ 300,000 Complete Streets 30.1 Upper Market Pedestrian Improvements MTA $ 2,217,100 Transit 4 Light Rail Service Enhancement MTA $ 5,250,000 Complete Streets 31 Predevelopment -Upper Market Pedestrian Improvements MTA $ 50,000 Transit 5 Polk Street northbound bicycle improvements MTA $ 50,000 Complete Streets 32 Re-establish Octavia Boulevard ROW with Hayward Park DCP $ 150,000 Transit 6 Van Ness BRT -Van Ness and Mission Ped. improvements MTA $ 1,500,000 Complete Streets 33 Sidewalk Greening Program DPW $ 700,000 Transit 7 Hub Transportation Improvements Study DCP $ 250,000 Complete Streets 34 Streetscape Enhancement Fund DPW $ 2,350,000 Transit 8 Valencia Protected Bike Lanes* MTA $ 2,604,231 Complete Streets 34.1 Streetscape Enhancement Fund MTA $ 2,350,000 Transit 9 Western Adddition CBTP Improvements MTA $ 725,000 Complete Streets 35 Koshland Park Access Improvements MTA $ 450,000 Transit 10 HUB Transportation Improvements Fund MTA $ 304,000 Complete Streets 36 Van Ness BRT -Van Ness and Mission ped. MTA $ 500,000 Transit 10.1 Local Bus TSP MTA $ 196,000 Complete Streets 37 Neighborhood Heritage Program DCP $ 50,000 Complete Streets 19 Dolores and Market Intersection Improvements (In-kind) IN-KIND $ 513,000 Complete Streets 38 Octavia Boulevard Irrigation System DPW $ 100,000 Complete Streets 21 12th/Otis Plaza IKA IN-KIND $ 3,000,000 Complete Streets HUB Public Realm Improvements Plan DPW $ 6,000,000 Complete Streets 23 Hayes Two-way MTA $ 49,000 Complete Streets 39.2 13th Street MTA $ 175,000 Complete Streets 24 Living Alleys Community Challenge Grants DPW $ 3,000,000 Rec and Open Space 44 Hayward Park RPD $ 7,984,000 Complete Streets 24.1 Living Alleys Community Challenge Grants ADM $ 500,000 Rec and Open Space 45 Brady Block Park -design DCP $ 200,000 Complete Streets 25 Better Market Street -Market from 10th to Octavia DPW $ 1,500,000 Rec and Open Space 46 Community Challenge Grant ADM $ 100,000 Complete Streets 26.1 Page Street Neighborway MTA $ 1,000,000 Rec and Open Space 47 Buchanan Street Mall RPD $ 3,615,000 Complete Streets 26.2 Page Street Neighborway DCP $ 250,000 Rec and Open Space 48.25 11th and Notama RPD $ 1,000,000 Complete Streets 27 Patricia's Green Rotating Art Project ARTS $ 360,000 Child Care 53 OECE Child Care NOFA Program OECE $ 1,273,000 Complete Streets 28 Market/Octavia Plazas Rotating Art Project ARTS $ 50,000 Complete Streets 29 Pedestrian Improvements Franklin and Gough intersections MTA $ 250,000 Total $ 53,333,488
MO Expenditures Appropriated not Transferred and Programmed Previously Appropriated - Funds not yet Transferred Line Item No. Programmed FY27 through FY 29 Category Project Title Agency THROUGH FY29 MO Transit Transit Complete Streets Complete Streets Complete Streets Complete Streets Complete Streets Complete Streets Complete Streets Complete Streets Recreation and Open Space Recreation and Open Space Recreation and Open Space Recreation and Open Space Recreation and Open Space Child Care Admin Total 8 10 20 24 25 27 32 33 34 39 47 48.25 48.5 48.75 48.9 53 59 Valencia Protected Bike Lanes* HUB Transportation Improvements Fund Oak Plaza In-Kind Living Alleys Community Challenge Grants Better Market Street -Market from 10th to Octavia Patricia's Green Rotating Art Project Re-establish Octavia Boulevard ROW with Hayward Park Sidewalk Greening Program Streetscape Enhancement Fund HUB Public Realm Improvements Plan Buchanan Street Mall 11th and Notama Civic Center Koshland Park Other Open Space OECE Child Care NOFA Program Program Admin MTA MTA In-Kind DPW DPW ARTS DCP DPW DPW DPW RPD RPD RPD RPD RPD DEC DCP $ 2,045,769 $ 5,515,860 $ - $ 7,754,140 $ 2,180,893 $ 500,000 $ - $ 300,000 $ - $ 600,000 $ - $ 11,355,628 $ 505,250 $ 505,250 $ 2,524,345 $ 2,000,000 $ 3,563,590 $ 3,203,000 $ 132,150 $ 35,124,246 $ 2,045,769 $ 13,270,000 $ 500,000 $ 500,000 $ - $ 150,000 $ 1,000,000 $ 500,000 $ 300,000 $ 150,000 $ 2,000,000 $ 5,468,372 $ - $ 2,100,000 $ - $ 2,000,000 $ 16,824,000 $ 505,250 $ 2,605,250 $ 2,524,345 $ 2,000,000 $ 3,563,590 $ 8,011,000 $ 3,238,300 $ 61,318,397 $ - $ 4,808,000 $ 3,106,150 $ 26,194,151 Revenue FY24 through FY29 $ 32,845,000 $ (28,473,397) Deficit
IPIC Expenditure Plans for FY26 FY30 Projections will be prepared through new methodology No revenue across any Area Plan yet this year No additional projects will likely be funded Will continue to prioritize projects that are shovel-ready and those that have been waiting the longest
IPIC Expenditure Plans for FY26 FY30 https://files.sfplanning.org/doc uments/publications/ipic/IPIC _Annual_Report-2024.pdf