Future Pressures Projection in Gaborone, Botswana, May 2015
This chapter delves into the projection of future pressures in Gaborone, Botswana, from the perspective of Tales Carvalho Resende in May 2015. Explore the anticipated challenges and trends shaping the region's future landscape.
Download Presentation

Please find below an Image/Link to download the presentation.
The content on the website is provided AS IS for your information and personal use only. It may not be sold, licensed, or shared on other websites without obtaining consent from the author.If you encounter any issues during the download, it is possible that the publisher has removed the file from their server.
You are allowed to download the files provided on this website for personal or commercial use, subject to the condition that they are used lawfully. All files are the property of their respective owners.
The content on the website is provided AS IS for your information and personal use only. It may not be sold, licensed, or shared on other websites without obtaining consent from the author.
E N D
Presentation Transcript
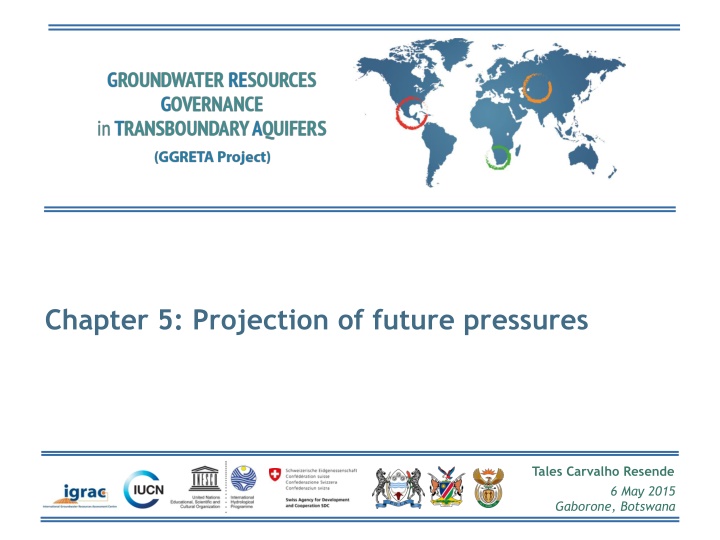
Chapter 5: Projection of future pressures Tales Carvalho Resende 6 May 2015 Gaborone, Botswana
Objective Provide projections on how current conditions and uses of the STAS might develop during the next decades. Different groundwater indicators under current and projected conditions in 2030 and 2050 were computed for the STAS using WaterGAP - a global hydrological and water use model - to assess the human-freshwater system under historical and future climate conditions. Indicators aim at synthesizing and presenting: the value of the aquifer system and its potential functions, the role and importance of groundwater for humans (and the environment), changes in groundwater state, drivers of changes and pressures. 2 2
Presentation of WaterGAP Model Global hydrological and water use model developed by the University of Frankfurt that aims at investigating current and future worldwide water availability and water use, and the development of water stress conditions at different spatial and temporal scales. Results of WaterGAP have contributed to international assessment of the global environmental situation such as the UN World Water Development Reports and reports of the Intergovernmental Panel on Climate Change (IPCC). Current-state scenarios are computed using a consistent set of global climate data. Projections are based on five climate scenarios that were computed by five global climate models for the highest Intergovernmental Panel on Climate Change (IPCC) greenhouse gas (GHG) emissions scenario (RCP8.5) which assumes that emissions continue to rise throughout the 21st century 3 3
Presentation of WaterGAP Model Only one unconfined aquifer is modeled Cannot be assigned to individual aquifers (e.g. Kalahari, Auob and Nossob) Livestock water use neglected in this study: An analysis of consumptive water use of livestock in 2010 showed that values of less than 1 mm/yr occur in most TBAs. Horizontal GW flow between cells as well as capillary rise is not taken into account. - The effect of neglecting these processes on groundwater depletion and groundwater development stress, however, is considered to be small compared to uncertainties regarding estimated groundwater recharge and abstractions. 4 4
Indicators Indicators: Mean groundwater recharge Mean per-capita groundwater recharge Population density Human groundwater dependency on groundwater for domestic use Human groundwater dependency on groundwater for irrigation Groundwater depletion Groundwater development stress 2 categories: Indicators of current conditions. Indicators of projected future conditions. These indicators attempt to predict the future, 20-40 years ahead, based on extrapolation of observed data, assumed trends and some basic transfer relation (model). Hence the indicators of this category are subject to uncertainty and should be used with caution. 5 5
Indicators of projected future conditions 2 scenarios: Scenario 1: constant irrigated areas until 2050, Scenario 2: changed irrigated areas in 2030 and 2050 defined by modeled percent changes per country. 6 6
Results Current-state: Mean annual groundwater recharge depth is low (approximately 3 mm/yr). Annual amount of renewable groundwater resources per capita is high (approximately 6650 m3/yr/capita). No drawdown of STAS aquifer levels as a result of abstractions. Such results have also been obtained by NASA s Gravity Recovery and Climate Experiment (GRACE) observations: 7 7
Results Current-state (cont d): Total water abstraction for irrigation is close to 100% Groundwater development stress (abstraction / recharge) is currently very low (approximately 2%) Projections: Population density is expected to increase by 30% and 55% in 2030 and 2050, respectively. Annual amount of renewable groundwater resources per capita increase by 40% in 2050. Increase of groundwater development stress (abstraction / recharge) by 15% in Scenario 1 (constant irrigated areas) and 100% in Scenario 2 (changed irrigated areas) in 2030. 8 8
