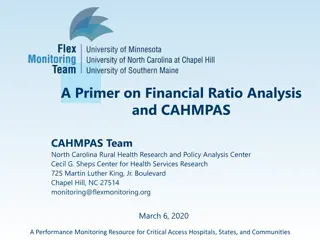
FY 21 Financial Results Overview: Operating Revenues, Expenses, Highlights
Explore a comprehensive overview of the FY 21 financial results including operating revenues, expenses, balance sheet highlights, and more. Gain insights into the organization's financial performance in 2021.

Download Presentation

Please find below an Image/Link to download the presentation.
The content on the website is provided AS IS for your information and personal use only. It may not be sold, licensed, or shared on other websites without obtaining consent from the author. If you encounter any issues during the download, it is possible that the publisher has removed the file from their server.
You are allowed to download the files provided on this website for personal or commercial use, subject to the condition that they are used lawfully. All files are the property of their respective owners.
The content on the website is provided AS IS for your information and personal use only. It may not be sold, licensed, or shared on other websites without obtaining consent from the author.
E N D
Presentation Transcript
Overview of FY 21 Financial Results November 19, 2021
Agenda Background Operating Summary Operating Revenues Operating Expenses Balance Sheet Cash and Investments Long-Term Portfolio Asset Allocation Questions 2
Background Solid and stable financial position Highest Moody s and S&P bond ratings (Aaa and AAA) Size of the health care system The colors of money Endowment Size 3
Financial Highlights Summary of Operations 2021 2020 2019 2018 2017 (in millions) Operating revenues and educational appropriations $ 8,831 $ 8,340 $ 8,411 $ 7,879 $ 7,480 Federal economic relief funds 256 144 - - - Private gifts for operating activities 184 179 178 197 159 Operating and net interest expenses (9,608) (9,445) (9,099) (8,625) (7,976) (337) (782) (510) (549) (337) Net investment income 5,141 323 810 1,261 1,401 Endowment and capital gifts/grants and other 176 182 223 208 198 Increase (decrease) in net position $ 4,980 $ (277) $ 523 $ 920 $ 1,262 4
Financial Highlights Operating revenues and educational appropriations 2021 2020 2019 2018 2017 (in millions) Student tuition and fees, net $ 1,481 $ 1,456 $ 1,367 $ 1,311 $ 1,241 State educational appropriations 373 331 370 363 356 Sponsored programs 1,318 1,313 1,317 1,278 1,224 Patient care revenue, net 5,351 4,768 4,845 4,439 4,200 Other 308 472 512 488 459 Total operating revenues and educational appropriations $ 8,831 $ 8,340 $ 8,411 $ 7,879 $ 7,480 5
Financial Highlights Expenses 2021 2020 2019 2018 2017 (in millions) Compensation $ 4,369 $ 4,112 $ 3,868 $ 4,592 $ 4,581 Benefits 1,400 1,319 1,196 1,546 1,469 Supplies and services 2,524 2,402 2,164 2,614 2,575 Depreciation 568 569 538 567 567 Scholarships and fellowships 164 157 144 200 173 Interest expense, net 74 66 66 89 80 Total operating and net interest expenses $ 9,608 $ 9,445 $ 9,099 $ 8,625 $ 7,976 6
Financial Highlights Balance Sheet June 30, 2021 2020 2019 2018 2017 (in millions) Cash, unexpended bond proceeds and investments $ 21,200 $ 15,996 $ 14,873 $ 14,229 $ 13,229 6,187 6,273 Capital assets, net 6,227 6,121 6,045 1,676 1,235 Other assets 1,392 1,329 1,229 Total Assets 22,492 21,679 20,503 29,063 23,504 1,124 514 Deferred outflows 371 384 349 3,314 3,376 Commercial paper and bonds payable 2,475 2,394 2,318 440 303 Insurance and benefit reserves 232 235 214 Obligations for postemployment benefits 4,412 3,478 3,114 3,304 3,198 2,060 1,863 Other liabilities 1,718 1,656 1,678 Total Liabilities 7,539 7,589 7,408 10,226 9,020 454 471 Deferred inflows 520 193 83 Net position $ 19,507 $ 14,527 $ 14,804 $ 14,281 $ 13,361 7
Financial Highlights Cash and Investments June 30, 2021 2020 2019 2018 2017 (in millions) Cash and cash equivalents $ 1,004 $ 1,275 $ 397 $ 133 $ 105 Current investments 2,611 1,891 1,551 1,708 1,703 Noncurrent: Unexpended bond proceeds 52 126 91 83 98 Endowment investments 17,023 12,313 12,449 11,902 10,936 Life income funds 191 145 147 144 132 Self-insurance reserves 293 225 216 208 205 Other investments 26 21 22 51 50 Total cash, unexpended bond proceeds and investments $ 21,200 $ 15,996 $ 14,873 $ 14,229 $ 13,229 8
Long-Term Portfolio Allocations As of June 30, 2021 9
Questions ? 10