Explore a study on GABA content comparison in vegetative tissues of wild-type and genome-edited plants, along with in vitro CaM-binding assays and quantification of transgenic lines. Primers used in the study are also detailed. Discover the insights gained from these experiments.
Please find below an Image/Link to download the presentation.
The content on the website is provided AS IS for your information and personal use only. It may not be sold, licensed, or shared on other websites without obtaining consent from the author. If you encounter any issues during the download, it is possible that the publisher has removed the file from their server.
You are allowed to download the files provided on this website for personal or commercial use, subject to the condition that they are used lawfully. All files are the property of their respective owners.
The content on the website is provided AS IS for your information and personal use only. It may not be sold, licensed, or shared on other websites without obtaining consent from the author.
E N D
Presentation Transcript
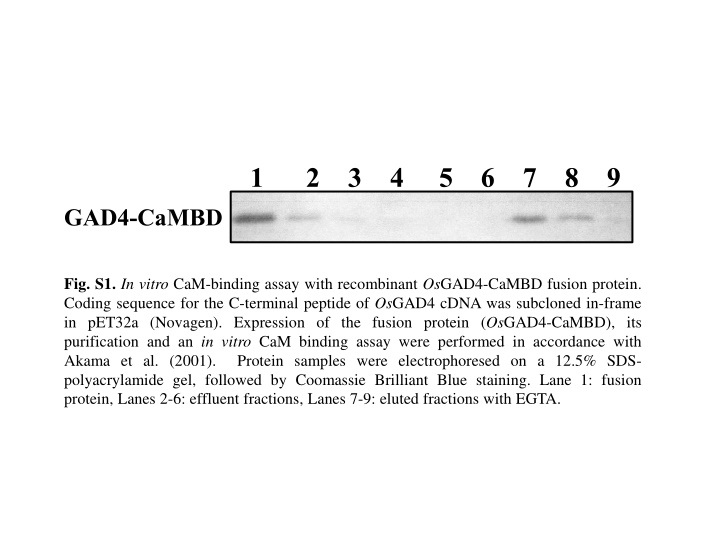
1 2 3 4 5 6 7 8 9 GAD4-CaMBD Fig. S1. In vitro CaM-binding assay with recombinant OsGAD4-CaMBD fusion protein. Coding sequence for the C-terminal peptide of OsGAD4 cDNA was subcloned in-frame in pET32a (Novagen). Expression of the fusion protein (OsGAD4-CaMBD), its purification and an in vitro CaM binding assay were performed in accordance with Akama et al. (2001). Protein samples were electrophoresed on a 12.5% SDS- polyacrylamide gel, followed by Coomassie Brilliant Blue staining. Lane 1: fusion protein, Lanes 2-6: effluent fractions, Lanes 7-9: eluted fractions with EGTA.
Base pair (bp) 500 400 300 200 100 20 Fig. S2. Screening of regenerated candidates (T0) through PCR and electrophoresis analysis by MULTINA (Shimadzu, Kyoto, Japan). We selected ten lines (three lines are shown) producing shorter band (along with the 400 bp band), B-type; as numbers 3, 6 and 7 in this figure. The rest are W-type lines producing only one band of 400 bp.
Table S1.Quantification of transgenic lines Total number of transgenic lines Type of transgenic lines Number of individual plants Percentage (%) W type 170 94.4 T0(27) Bi-allelic (B) type 10 5.6 W type ~114 ~44 Bi-allelic (B) type ~75 ~29 T1 (10) C type (expected band size) ~70 ~27 Table S1. Number of transgenic plants produced (T0 & T1) and their allelic states. We used the symbol ~, because during electrophoresis, some samples produced unclear bands, and few produced no band. So, this value is approximately or roughly counted.
0.9 0.8 0.7 GABA (nmol/mg FW) 0.6 0.5 0.4 0.3 0.2 0.1 0.0 Ni L #14-1 L Ni S #14-1 S Ni R #14-1 R Fig. S3. GABA content comparison in vegetative tissues of wild-type Ni and GAD4 genome-edited line (#14-1). Measured by GABase assay. L=leaf, S=stem and R=root tissue
Table S2. Primers used in present study Name Experiment Sequence (5 to 3 ) Genome editing gRNAF1-F GTTGGCCCGCGTCGTCGCCAACGG gRNAF1-R AAACCCGTTGGCGACGACGCGGGC gRNAR1-F GTTGGGATGAGAGCAGACTTGAGA gRNAR1-R AAACTCTCAAGTCTGCTCTCATCC Analysis of genome edited plants GAD4- F1 CATCCGCGAGGACTTCAG GAD4- R356 TCAATACGAAGCATT RT-qPCR GAD4-F ACCGTCTCAAGTCTGCTCTCAT GAD4-R TCAATTCACTGCTACACACCCA Internal control in RT- qPCR TBP2-F TGGTCTGGAGGAGCGTATAGCA TBP2-R CAAGTCTCTCAGTCACCCAAGC